Role of Digital Transformation in Achieving Operational Excellence in the Process Industries
What is Operational Excellence?
In the business world, the term “operational excellence” is becoming extremely popular. But what is “Operational Excellence”? We need to put Operational Excellence into context before we can define it. “Operational Excellence” refers to efforts made at the individual process level within a company. In reality, it necessitates using Deming’s Circle: design, execute, and improve any process.

Simply said, operational excellence means producing or providing goods and services to the highest possible standard. To begin, we can put it into action by optimizing at each level. It all starts with people, then processes, and finally resources or assets.

Operational excellence transforms a company that effectively conducts and executes value-driven activities safely and efficiently. Furthermore, digital transformation can assist businesses in achieving operational excellence and transitioning from automated to autonomous operations.
What is the current state of operational excellence in the process industries?
Numerous process sectors have so far tried to achieve operational excellence using a variety of ideas and techniques, but they have encountered various challenges with standardization, adoption, and scalability that have hindered their capacity to enhance and boost output quality.
The complexity of the process, its opaque operation, and the overall organizational culture’s resistance to change were the primary challenges.
Why to choose Digital Transformation?
The major role of digitalization is to assist in the reduction of the complexity of manually operated processes and the creation of a transparent overview of the process by utilizing the vast data available.
The following are some solutions that digital transformations bring specifically to process industries: data reporting solutions like dashboard development or asset health monitoring, overall equipment efficiency.
Data-driven solution models such as soft sensors, or advanced solutions such as predictive maintenance rather than heuristics/experience-based approach, which reduces reliance on trained/experienced people and shortens the training period for novice operators.
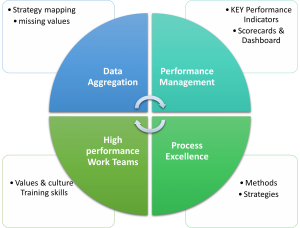
Operational excellence using Digitalization in the process industry
It entails using well-known and stable concepts of operational excellence in conjunction with digital solutions to improve the performance of people, processes, and assets; in other words, it will assist an industry in upskilling entire organizational culture. By narrowing the gap between departments and levels within the organization’s hierarchy.
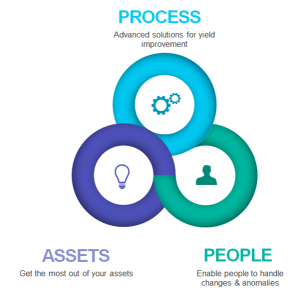
Optimized Organizational Culture
Many industries have begun their digital transformation journeys, and those who have not yet begun their journeys plan to do so at various levels of digital transformation. According to a Fujitsu survey, 44 percent of respondents from offline firms believe that by 2025, more than half of their non-automated business operations will be automated.
Industries should be able to connect the stages of digital transformation; they need to know where they are in the process and what output they want, since alternative solutions can be supplied based on the requirements using a step-by-step method.
From the initial sensor installation to the conversion of manual data to digital data, the data is then centralized in DCS for control and monitoring. A reliable communication layer between the IT and OT networks, as well as an analytic solution for monitoring/modelling process data.
The Operating Training Stimulator (OTS) can also be developed to give new operators plant experience, bridging the gap between a trained and untrained operator. Data visualization and reporting ensure that the process is understood and clarified. Data can be utilized to build a first principal model and check the data’s theoretical and actual trends. For non-linear processes, data-driven models such as regression models can be created. Soft sensors for parameters with a given time lag are developed so that live empirical values are accessible before time, condition-based monitoring to ensure a batch follows a golden batch profile and we get the best yield.
Conclusion:
Upskilling of people, processes, and assets is a necessity for process industry, operational excellence and its principle’s assist in performing well in the process industry at all levels of the business. But hindrance due to complexity of the nature of operation in process industries became a major problem. Digital transformation reduced it by providing highest level of transparency in the manual operational process and upskilled individuals in the organizational hierarch.
Written by,
Adarsh Sambare and Kishan Nishad
Data Scientists
Tridiagonal Solutions
- Published in Blog
Optical Character Recognition – OCR in Manufacturing Industry

Introduction:
Despite digitization, most industries still rely on traditional methods for recording the data, such as manually filling out logs, excels, etc. But as the world moves into the digital age, industries are also making their way to storing data digitally.
To store a large amount of data, what steps should one take?
It would be helpful if we typed each word individually, wouldn’t it? It will be extremely tedious, time-consuming, and stressful to type every word. OCR technique comes in handy here. OCR stands for optical character recognition, part of computer vision technology. OCR allows you to convert different kinds of documents like images, pdf and scanned photos into machine-readable and editable forms.
What is OCR:
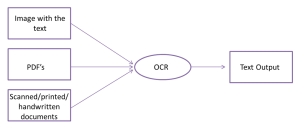
Optical Character Recognition (OCR) is a technique for extracting data from scanned documents. It uses either rule-based or AI-based approaches for recognizing text. The rule-based approach involved inspecting the area based on coordinates and hard-coded rules in the form of if-else statements. In contrast, AI-based OCR solutions develop rules on their own and continually improve them as they go along.
Rule-based approach are useful when extracting only a certain amount of information from a page and store it in tabular form for further analysis. The AI-based approach is suitable if all the information from the scanned page needs to extracted as it is without any modification.
How OCR Works:
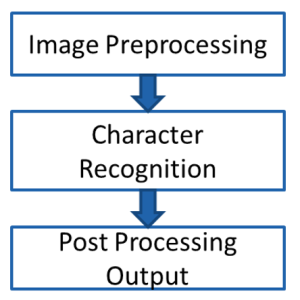
For the OCR technique to work effectively, we must process the image before feeding it to the engine. As part of preprocessing, we first convert the image into a grayscale and perform various morphological operations such as dilation, erosion, opening, and closing. This operation depends upon the kind of information you need to extract. For example, if you wish to extract simple text information contained in the image, simple operations like dilation and erosion work. However, information extraction from the table required intense morphological operations. Once information extracted, we performed a post-processing operation to get the data into the desired form.
Scope of OCR in the Manufacturing industries:
A batch ID, lot code, storage condition, and expiration date play a vital role in pharmaceutical data analysis. Each entry from the pdf report must be transcribed into an Excel sheet. It takes a lot of time and effort to complete this task. This effort could be saved by utilizing OCR technology. You can store the information in an Excel sheet after it is extracted from the pdf files.
It is common in the cement or chemical industry to store data in log sheets. OCR can extract this data and can output it as text. We further process that text output into a tabular form so the analyst team can analyze the process and act on the insight gathered from the data.
Many industries are using this technique to start their digitization journey, if you want to be part of this, connect with us at analytics@tridiagonal.com
Written By:
Nikhil Bokade
Data Scientist
Manufacturing Excellence Digital Transformation Group
- Published in Blog
Digital Transformation – Revolutionizing the Process Industry

Courtesy: Pixabay
Introduction
“Technology is best when it brings people together”
“Technology is best when you use it wisely”
“Data is the real evidence”
That’s right, today in this world of the digital era, we are all surrounded by digital technologies, tools & data. Everyone of us is now becoming a part of it, some driving it, and some being driven by it. For some, it’s incremental and for some it’s disruptive. But we all are the victim of this change.
There are mixed opinions on the adoption of these technologies, where for some it has brought huge realization in terms of ROI/monetary savings, whereas for some it has been futile. And with these opinions what would be your take?
In this article, our focus would be oriented more around the process and manufacturing space, which would fairly cover the space of oil & gas, spec. chem, pharma, heavy metals and other similar industry. This industry is heavily the function of the following: people, process and environment. Which means that, technology is expected to support and help each and every element of the industry.
Let’s dive a little deep into the core of digital transformation elements in process and manufacturing space.
Journey of Digital Transformation
Digital is the new revolution. The decisions are bound to be made through the insights and foresight what your data shows, and not solely based on your experience. This transformation is supposed to help you with intelligent systems that has the potential to increase the productivity, and performance in a sustainable way.
Technology being a major driver for this journey, also implies that, the group of users who shall be driving it need to have a strong hold on it, and should have a fair idea about its implications and consequences, if not handled well. Don’t worry, this article is not intended to trigger the alarm of fear in you, but rather to set off digital awareness. That’s right, “digital awareness” because, you are going to invest in an expensive, high-tech solution, which requires well-experienced drivers who are expected to be technology experts, and domain experts and has the same vision as that of the organization. It really starts with the identification of the first group of users and drivers who are going to utilize the technology, evaluate its functionalities and potential to satisfy the business KPIs. They really determine, whether the technology is going to be the high value solution or is it going be in vain. The adoption and scalability of the technology is going to be the function of the users representing the organization’s culture, with a strong understanding of the hierarchy and people in the organization, and then comes the digital readiness & processes and operations.
It’s not just an IT-solutions, rather, it’s a solution which has the potential to support and uplift all user groups at different levels and different teams- be it production, plant, maintenance, HR, IT, the management or any others.
In simple words, digital transformation is about automating the repetitive tasks, and supported with the informed decisions – upskilling the people and automating the process. Its all about identifying the digital driver, and digital levers?
Below is the schematic representation of how to strategize your operational excellence for digital transformation.
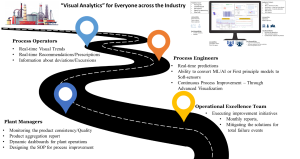
Fig. Strategize your Digital transformation roadmap for remote monitoring operations
Who should transform?
Anyone and everyone who has the set vision & goals for enhancing the work culture and bringing about the positive change and has a mission to think beyond the approach of siloed, centralized and disparate to collaborative, decentralized and orchestrated way of working should admire the benefits of digital transformation.
Operational/manufacturing excellence teams, whose task is to bring about benefits in the process and manufacturing through better and intelligent solutions can realize the benefits at various level. They can realize it through condition-based monitoring, predictive & prescriptive analytics, decision support systems and optimization in real-time. This has the potential to eliminate the shop floor variabilities, when it comes to experience based decisions, which is not backed by any beyond-human intelligence. One has to adopt such technologies which can add the layer of intelligence to the overall process and operations for making better and informed decisions. (https://dataanalytics.tridiagonal.com/digital-transformation-for-the-process-industry/)
Summary
Digital transformation is the new approach, and one has to adopt it before its too late. Technology itself cannot suffice the business requirements, rather it has to be applied on top of the human intelligence, which we apply on our routine-basis. Having the right drivers and stakeholders is a key to the successful implementation of digital transformation. Moreover, digital transformation has a huge potential in manufacturing and operations space, and one can start right from automating their regular and repetitive and manual tasks which currently is been performed on daily basis. It also helps the organization to look into their current challenges with a different lens and tangent, which could have been easily missed out otherwise.
Written by,
ParthPrasoon Sinha
Principal Engineer – Analytics
Tridiagonal Solutions
https://dataanalytics.tridiagonal.com/
- Published in Blog
Digital Transformation for the Process Industry

“Digital Transformation” is the adoption of the novel “Advanced Digital Technologies” to create modified processes from existing traditional processes. With Digital Transformation for the Process Industry being implemented in the Chemical/Manufacturing space, we have gained the realization that these tech stacks have high potential to achieve and improve efficiency, value.
Digital Transformation is a part of “INDUSTRY 4.0”, which involves wider concepts such as solutions on deep analytics, shop floor data sensor, smart warehouses, simulated changes, plus tracking assets and products. Industry 4.0 is an overall transformation taking place in the way goods are produced and delivered.
Process Industry is under constant pressure to meet the production target while minimizing the cost and maximizing product quality. Digital Transformation of the underlying assets can help them achieve this target. However, only incremental innovation and digital transformation have been seen in the last decade.
The major fundamental challenges in manufacturing process digitalization, are listed below:
- Outdated Systems
- Resistance to change (Disruptive V/S Incremental Change)
- Rigid Infrastructure
- Privacy Concerns
- Lack of Overall Digitization Strategy
In this article, an approach/ framework for digital transformation for the process industry will be discussed keeping the fundamental challenges in focus. A flexible framework that needs to change as per the industry requirements.
4 – Staged approach for an effective Digital Transformation in Manufacturing Space
Following are the stages for the journey of digital transformation:
- Stage: 1 Data Availability
- Stage: 2 Data & Asset Management
- Stage: 3 Data storage
- Stage: 4 Operationalizing the data
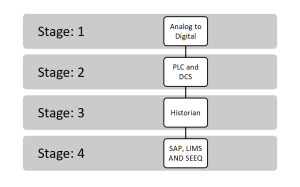
- Stage: 1 Data Availability
Utilization of manual operation or having limited or no digital control. But the manufacturer is ready to modernize its system from analog to digital. Focus being on adapting the right solution, sources of data, the adaption of the sensor, convert manual data to digital. One key aspect at this stage is to implement and integrate these sensors/IOTs, which follow the open protocols for communicating with the 3rd party applications.
- Stage: 2 Data & Asset Management
After the application of the sensor and converting manual data to digital, the data is then centralized to the PLC and DCS, to permit control, monitoring, and reportage of individual elements and processes at one location. This stage also becomes critical as basic instrumentation and controls would be the foundation for enterprise-wide digital solutions. It also makes us to think about the Integrity of the data – accuracy, consistency, completeness. Representation of data becomes very critical as we expect it to be speaking for the process itself, additionally maybe also about how the operations were considered on the shop floor.
- Stage: 3 Data Storage
Although DCS/SCADA enables the shop-floor team to take the decisions, but it is limited in terms of storing the historical data, which becomes a key for Digital transformation. To our rescue, comes the historian, which extends its capability to store large volume of data, additionally, today everyone is also talking about cloud-ready solutions, which provide us unlimited/remote storage/compute capability to process and derive the insights from our data.
- Stage: 4 Operationalizing the Data
Having your data available in the OT network still doesn’t help in operationalizing the data. Today, every Industry in targeting for remote monitoring, online notifications, and more. To achieve such targets, one really needs a robust layer of communication between the IT/OT network and moreover, an analytic solution for monitoring/modeling the process data. The COE team sitting remotely can monitor the real-time operations, support the operations with technological know-how.
Conclusion:
It is very much evident that Digital Transformation is of high-value journey for the Manufacturing / Process industry, but it really depends on the approach and the methodology which was undertaken to achieve the KPIs. Moreover, it also depends on the people who are involved in this journey of transformation. One needs to be well acquainted with technology, process challenges, the scope of improvements, and others.
Tridiagonal Solutions – a company specializing in providing knowledge/ insights-based solutions for the Process Industry. With strong process domain knowledge, we help companies in KPI-based advanced Analytics
Written by,
Adarsh Sambare
Data Scientist
Tridiagonal Solutions
https://dataanalytics.tridiagonal.com/
- Published in Blog
Machine Learning Model Monitoring in Process Industry (Post Deployment)
Machine learning by definition is a relationship which is established between a set of input variables and an output variable. Specifically, in process industry identification of this relationship becomes a difficult task, as it becomes highly non-linear at cases. The internal dynamics and behavior of the operator operating the process is something that comes under the interest of the ML/AI models. It tries to capture all of such instances which can be realized through the data it has been exposed to.
What’s Drifting in your Process – Data or Concept?
In this article, we are going to look into a very interesting and important concept of data-driven/Machine learning techniques. With the rapid development in technologies, industries have figured out multiple ways to estimate the performance of their deployed Machine learning/AI solution. One among them is drift – data drift and concept drift. Today, almost every industry is sitting on their-own data mine, longing enough to extract whatever information they could derive out of it. But, with such a surge in the industrial applications, it has also brought to our knowledge that there are lot many challenges involved at various levels of implementation. These challenges start right from the data itself – Integrity of the data, behavior and distribution of the data and so on. Sometimes, we end up spending most of our time in developing the process model (Machine learning model), which performs too well on the training dataset, but when tested on the live data- its performance drastically reduces. What do you think, what could have gone wrong here? Are we missing something or are we missing a lot? We shall pick this again later, with more details to it.
Types of Model Drift in Machine Learning
Data Drift & Concept Drift:
Now let’s talk about data drift and concept drift. Data drift is a very general terminology, which has a common interpretation across, whereas, concept drift is something which makes us think/re-think about the underlying domain know-how. Today, whoever thinks of starting their digitalization journey has a very fundamental question in their mind – whether or not the data is sufficient to build the machine learning model? The answer to this could be both yes and no, and it really depends on the methodology and the assumptions one had made while developing the model. Let us try to understand this with a simple example.
Data Drift:
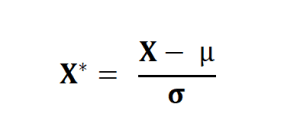
Let’s assume you have used a standard scaler in one of your predictive maintenance or quality prediction or any other similar Machine learning/AI project. Which means that, for all the data points you’re transforming your sensor data/failure data/quality data based on the below equation:
Essentially we are transforming our dataset in such a way that for every process parameters in X has a mean of 0 and standard deviation of σ. Before we move ahead, one has to be conceptually clear about the difference between the sample and the population. Population is entire group of possibilities of scenarios, whereas the sample is the subset of the population. Generally, we assume that no two samples drawn at random are different from each other. Which means that we also assume that the mean and SD of the population is equal to that of any random sample which we draw from the entire dataset.
To understand it in much better way, let us take the example of the Heat exchanger predictive maintenance. The population dataset is the entire dataset inclusive of the process parameters, downtimes, maintenance records right from the day 0 of the process. The sample of the dataset could be the last 1 year data. One of the reasons why we are selecting only last 1 year data could be that – maybe the data is not available for the process since the beginning, as it was not stored. So, one is forced to assume that the mean and SD of the past 1 year data is representative of the entire span, which could be a wrong expectation.
Let’s say you have developed the machine learning model on top of this transformed dataset, with an acceptable level accuracy for training/validation/cross validation dataset, and deployed the model in real-time exposed to the live data. Here the model will transform the new data with the same mean and SD which was used at the stage of training period. And, there is a high chance that the behavior (mean and SD) of your new dataset is very different than what you had estimated using the training dataset. This scenario will ultimately cause the performance degradation in your deployed model. This is what data drift means in process industry. The reason for this could be insufficient data in the training set, or any other on similar lines. Same thing applies to multiple scenarios like – MinMax Scaler, or any other scaler. MinMax scaler is based on the minimum and maximum value observed from the dataset, which could be completely different among the training, validation and testing sample dataset.
In the above example, we used the impact of scaling techniques to demonstrate the data drift, but like this, there could be multiple reasons for data drift, which brings in the requirement for not only looking into the model performance metrics but also into the data itself in a prudent way.
Concept Drift:
This happens when the concept, over the course of time changes. Which essentially means that the process data model (Machine learning) has yet not learnt the exact physics from the data? The reason for this could be multiple, such as insufficient volume of data considered for the training purpose. For Example, during the stage of step test in the APC implementation one may end up with an incomplete set of dataset, which could be misleading, as not all scenarios were considered for the learning purpose. Point to note here is that model is able to predict only those scenarios over which it was trained. So, if for some reason the training dataset doesn’t consist of certain specific scenarios, then model is susceptible to misinterpret and mislead the predictions. Let us continue with the example of heat exchanger, where the failure could be due to corrosion (A), mechanical issues (B), or improper maintenance (C). Now let’s assume that the training data consisted of the process parameters, failure logs and others contained only the information of the first 2 failure codes. So it still doesn’t know that there could be a possibility of failure due to improper maintenance (C). So, when deployed, model wouldn’t even predict C, even though there was an actual C. Also, we would have got a training, validation accuracy of more than 90/95%, but it was only considering the binary outcomes – A or B. By now, you must have had realized that even though the model performed so well while training, but during go-live it misinterpreted and misclassified the outcomes over which it was not trained upon. The essentially makes to rethink about the concept (scenarios) which we expected it to predict, but we didn’t feed it.


Fig-1. (a) Represents the good fit for training on dataset where relative humidity is centred around 50, (b) Represents the incorrect predictions due to drift in the values of relative humidity
Another classical example could be that of a process where we have temperature, pressure, flow, level, volume parameters, and we intend to predict the quality variable Y in real-time. Now, assume that in the training/validation dataset the variability of level and volume is not observed, which makes the machine learning model to assume that these parameters remain almost constant. (Assuming we are focusing on the production scale process, which is a set process, where the volume or the level doesn’t change appreciably during the operational period). So, by nature the model will set less weightage to these parameters, and will by default give them the least weightage. But from physics, we may know that there is a huge impact of level and volume on Y. But since the mathematical model doesn’t have this intellect, it will drop these parameters for prediction, and when we have a scenario of a volume or level change, this model will misinterpret the relationship and will predict the wrong outcomes. To counter such challenges, we have a variety of routes to bring this intelligence into the model, of which one can be as simple as gathering more and more data, until and unless all of the required scenarios are captured. Or, one can generate the synthetic data using steady-state, dynamic simulations which could one of the closest approximations to the real-life scenarios. Or, one may plan to set the first-principle constraint on the outcomes of the model, which can ensure that fundamentals of physics are not violated by any means.
We hope this article will help you to nurture and accelerate your process data model in a more refined way.
- Published in Blog
How You Can Solve Problems with Root Cause Analysis

Root cause analysis, or RCA, is an incredibly helpful process in identifying and solving problems in business. Particularly in industries like oil and gas and others in the sector, small problems can cause big issues, often without really becoming apparent. RCA is essentially designed to make it easier to spot these inefficiencies and imperfections, and thus take steps to address them.
With that said, RCA isn’t necessarily an exact or perfectly defined process you can simply put into action. It is more of a method that needs to be applied strategically. To that end, here are a few important ways to work toward solutions through root cause analysis.
Avoid Broad Assumptions
The quickest way to render RCA moot is to color your efforts with broad assumptions about what might be going wrong with the business. To give a simple example with regard to the energy sector, consider an oil and gas company that sees two months of profits lower than in the corresponding months from the year before. It’s a rather blatant example, but it’s, in theory, the sort of thing that might trigger some root cause analysis.
However, Coloring that analysis with assumption might mean assuming that the downward trajectory in business is part of a long-awaited clean-energy takeover. Many in oil and gas are apprehensive about alternative energy takeovers, and if lower profits correspond at all with positive news in renewables, the assumption comes naturally. One reason for the decline in business from one year to the next would seem likely to be a result of a broad market shift.
Not only is this too simplistic to result in much helpful insight, however — it’s also not necessarily likely to be true. Renewable energy is catching up, but is not yet in takeover territory. Indeed, an interview with a University of Cologne expert on the matter just last year was still discussing a more sustainable future in somewhat aspirational terms, suggesting that such a future will come about “when we finally realize we are all connected.” This doesn’t mean that alternative energy couldn’t be responsible for a decline in oil and gas profits. However, it does speak to how a broad assumption of this nature can be misguided, and can thus derail RCA before it really gets started.
Start Working Backwards
In a sense, the phrase “work backwards” just about describes the entire nature of a root cause analysis. This is a process through which you are meant to first identify a problem and then dig into what led to that problem until you find the very “root cause” behind it. However, there is a more specific way to go about this effort, which will ensure the greatest likelihood that you’ll follow the thread to its origin, so to speak.
An outline of proper RCA by Towards Data Science does an excellent job of illustrating the process in step-by-step terms, for those who are less familiar with it. Broadly, the steps are broken down into three parts: identifying contributing factors (to the problem); sorting those factors; and then classifying the factors. The sorting process involves ranking different factors by the likelihood that they caused the problem, whereas classification essentially means re-sorting into groups representing correlation, contribution, or “root cause” status.
Following these steps, you can also set about “designing for RCA,” which essentially means structuring business operations in a way that produces data and makes it easier to conduct future analyses. This incidentally, brings us to our next point regarding how you can bring about effective problem solving via root cause analysis.
Use Expert Data Analysis
Data analysis is so rampant in the industry today that it can seem like something you have to simply figure out how to implement yourself, or else purchase special software for. These are both options, but it’s also true that the spread of analytics has led to more of a workforce in the category too. Because of the clear value of data, many have gone back to school or pursued online degrees in order to qualify for excellent new jobs, and the result is a virtually bottomless pool of experts. Per the online master’s in data analytics program at Maryville University, numerous research and analyst positions in data are poised to grow by 10% or more over the course of this decade.
Oil, gas, and energy are not specifically mentioned, but as you likely know if these are the fields you work in, data analytics have very much entered the picture. This makes it reasonable to at least consider making use of educated data experts to “design for RCA,” and even conduct RCA when problems arise. While root cause analysis is designed in such a way that anyone with access to relevant information can go about it to some extent, a data professional will be more efficient at knowing what data needs to be visible, and how to make use of it in problem-solving.
Avoid Shallow Analysis
This final piece of advice is simply a reminder, but one to hold onto no matter how thoroughly you set up your RCA to be. In plain terms, make sure you aren’t doing shallow analysis, and stopping at identifying some causes but not a root cause.
By and large though, the path to effective problem-solving with root cause analysis is simple: Be thorough, use as much relevant data as you can, and don’t stop digging further into causes until you can’t go any further. To illustrate, check out how we used ‘Root-cause Analysis for Fault Detection’ in a previous post.
Written by,
Bernice Jellie
- Published in Blog
How Seeq enables the Practice of MLOps for Continuous Integration and Development of the Machine Learning Models
Introduction:
Due to the rapid advancement in technology, the Manufacturing Industry has accepted a wide range of digital solutions that can directly benefit the organization in various ways. One of which is the application of Machine Learning and AI for predictive analytics. The same industry which earlier used to rely on MVA and other statistical techniques for inferencing the parametric relationship has now headed towards the application of predictive models. Using ML/AI now they have enabled themselves to not only understand the importance of parameters but also to make predictions in real-time and forecast the future values. This helps the industry to manage and continuously improve the process by mitigating operational challenges such as reducing downtime, increasing productivity, improving yields and much more. But, in order to achieve such continuous support for the operations in real-time, the underlying models and techniques also need to be continuously monitored and managed. This brings in the requirement of MLOps, a borrowed terminology from DEVOps that can be used to manage your model in a receptive fashion using its CI/CD capabilities. Essentially MLOps enables you to not only develop your model but also gives you the flexibility to deploy and manage them in the production environment.
Let’s try to add more relevance to it and understand how Seeq can help you to achieve that.
Note: Seeq is a self-service analytics tool that does more than modeling. This article is assuming that the reader is familiar with the basics of the Seeq platform.
Need for Seeq?
Whenever it comes to process data analytics/modeling, visuals become very much important. After all, you believe in what you see, right?
To deliver quick actionable insights, the data needs to get visualized in the processed form which can directly benefit the operations team. The processed form could be the cleaned data, derived data, or even the predicted data, but for making it actionable it needs to be visualized. The solutions should peacefully support and integrate with the culture of Industry. If we expect the operator to make a better decision then we also expect the solution to be easily accepted by them.
MLOps in Seeq
For process data analytics models could accept various forms such as first principle, statistical or ML/AI models. For the first two categories, the management and deployment become simple as it is essentially the correlations in the form of equations. Also, it comes with complete transparency, unlike ML/AI models. ML/AI on the other hand is a black-box model, adds a degree of ambiguity and spontaneity to the outcomes, which requires time management and tuning of the model parameters. This could be either due to the data drift or the addition/removal of parameters from the model inputs. To enable this workflow Seeq provides the following solution:
- Model Development:
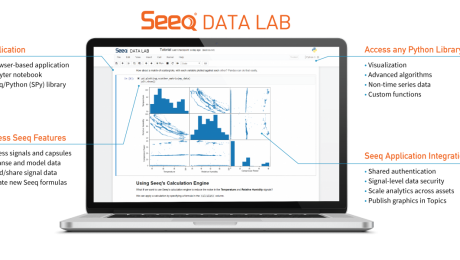
One can make use of Seeq’s DataLab (SDL) module to build and develop the models. SDL is a jupyter-notebook like interface for scripting in python. Using SDL you get the facility to access the live data to select the best model and finally create a WebApp using its AppMode feature for a low-code environment. As a part of best practice, one can use spy.push method to extract the maximum information out of the model using Seeq Workbench and advanced Visualization capabilities.
- Model Management (CI/CD):
Once the model is deployment-ready, the python script for the developed model can be placed in a defined location in the server for accessing the production environment. After successful authentication and validation, the model can be seen to have visibility in its list of connectors. This model can then be linked with the live input streams for predicting the values in real-time.
- Visibility of the Model:
Once the model is deployed in the production environment, one can continuously monitor the predictions and get notified of any deviations which may be an outcome of data drift. The advanced visualization capabilities of Seeq enables the end-user to extract maximum value/information out of the data with the ease and flexibility of its use.
For a better deployment and utility of MLOps, we recommend you apply visual analytics for your data and model workflow. Visual analytics at each stage of the ML lifecycle provides a capability to derive better actionable insights which could be easily scaled and adopted across the organization for orchestrating the siloed information and to unify them for an enhanced outcome.
Innovate your Analytics
I really hope that this article helped you to benchmark your strategy for deriving the right analytical strategy in your Industrial Digitization journey. For this article, our focus was on how Seeq can support the easy implementation of MLOps using Industrial manufacturing data.
Who We Are?
We, Process Analytics Group (PAG), a part of Tridiagonal Solutions have the capability to understand your process and create a python based template that can integrate with multiple Analytical platforms. These templates can be used as a ready-made and a low code solution with the intelligence of the process-integrity model (Thermodynamic/first principle model) that can be extended to any analytical solution with available python integration, or we can provide you an offline solution with our in-house developed tool (SoftAnalytics) for soft-sensor modeling and root cause analysis using advanced ML/AI techniques. We provide the following solutions:
- We run a POV/POC program – For justifying the right analytical approach and evaluating the use cases that can directly benefit your ROI.
- A training session for upskilling the process engineer – How to apply analytics at its best without getting into the maths behind it (How to apply the right analytics to solve the process/operational challenges)
- Python-based solution- Low code, templates for RCA, Soft-sensors, fingerprinting the KPIs, and many others.
- We provide a team that can be a part of your COE that can continuously help you to improve your process efficiency and monitor your operations on regular basis.
- A core data-science team (Chemical Engg.) that can handle the complex unit processes/operations by providing you the best analytical solution for your processes.
Written by,
ParthPrasoon Sinha
Sr. Data Scientist
Tridiagonal Solutions
- Published in Blog
Statistical and Machine Learning for Predictions and Inferences – Process Data Analytics
Introduction:
When it comes to the process industry, there are a plethora of operational challenges, but not a single standard technique that can address all of these. Some of the common operational challenges include identification of critical process parameters, control of process variables and quality parameters, and many more. Every technique has its own advantages and disadvantages, but to make its use at – its best, one should be aware of “What to use“, “And When”? This is really an important point to consider as there are so many different types of models that can be used for a “fit-for-requirement” purpose. So, let us try to have a deeper view of the modeling landscape.
Statistical models in the Process Industry
Statistical models are normally preferred when we are more interested in identifying the relationships among the process variables and output parameters. These kinds of models involve hypothesis testing for distribution analysis, which helps us to estimate the metrics, such as mean and SD of the sample and population. Whether or not, your sample is a generalized representation of your population? This is an important piece of concept which goes as the initial information for any model building exercise. Z-test, chi-squared, t-test (Univariate and multivariate), ANOVA, least squared and many other advanced techniques can be used to perform the statistical analysis, and estimate the difference in the sample and population dataset.
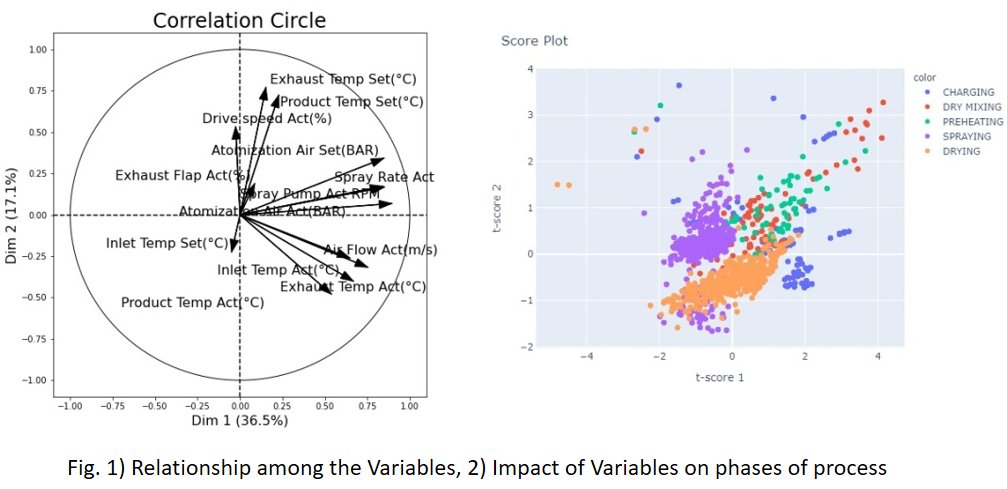
Let us try to understand this with an example: Considering the process of distillation, let’s say that you have the dataset available for its Feed Pressure, Flowrate, Temperature and Purity of the top stream. Now from its availability perspective, assume that you have 1 year’s worth of the data. Then, you segregated your dataset in some ratio, let’s go by 7:3 for training and testing purposes, and applied some model. But the model didn’t seem to comply with your expectations, in terms of the desired accuracy. So, what could have gone wrong? There are many possibilities, right? For the interest of this article let us just focus on the statistical inferences. So, since your model was not able to generalize its understanding on the distillation dataset, we may want to set an inquest for the dataset first. How? Did we compare the mean and SD of the train and test dataset? No? Then we should!! As discussed above, that to set up a model for reliable predictions, we need to be sure that the sample (In this case-training and testing dataset) is representative of your population dataset. This means that mean and SD values should not see much significant change in the above 2 datasets and also when compared to any random samples drawn from the historical population dataset. This also gives to us an idea about the minimum volume of the dataset which should be required to estimate the model’s robustness and predictability. Also to support the predictability confidence of any parameter on the output variable, we can use p-value. It essentially shows the statistical significance/feature importance of the input parameters.

Machine Learning Models in the Process Industry
So, now we have some idea on the importance of statistical models using process data. We can know the parametric relationship among each other and quality parameters. And then using the Machine learning models we can enable the predictions.
Typically, what we have seen in any process industry is, they need correlations and relationships in the form of an equation. A black-box model sometimes adds more complexity in the practical applications, as it does not provide any information on how and what was done to establish the prediction.

Sometimes even a model with 80% accuracy is sufficient if it provides enough information on the relationship is established among the process parameters. This being the reason, first, we always try to fit a parametric model, such as a linear or a polynomial model with the desired scale on the dataset. This atleast gives us a fair understanding of the amount of variability and interpretability contained in each of the paired parameters.
Conclusion
We can say that predictions and inferences/interpretability should always go hand-in-hand in the process industry for a visible and reliable model. The prediction itself is not sufficient for the industry, they need more, like – if the predicted value is not optimal or if it does not meet standard specifications, then what should be done? A recommendation or a prescription in the form of an SOP that the operator or an engineer can follow to bring the process back to its optimal state, which comes from the statistical inferencing. We suggest that for a strategic digitalization deployment across your organization, you use the best of both techniques.
To know more on how to use these techniques for your specific process application, kindly contact us.
Who We Are?
In case you are starting your digitalization journey or being stuck somewhere, we (Process Analytics Group) at Tridiagonal solutions can support you in many ways.
We run the following programs to help the industry along with various needs:
- We run the POV/POC program– For justifying the right analytical approach and evaluating the use cases that can directly benefit your ROI.
- A training session for upskilling the process engineer – How to apply analytics at its best without getting into the maths behind it (How to apply the right analytics to solve the process/operational challenges)
- Python-based solution– Low code, templates for RCA, Soft-sensors, fingerprinting the KPIs, and many others.
- We provide a team that can be a part of your COE– That can continuously help you to improve your process efficiency and monitor your operations on regular basis.
- A core data-science team (Chemical Engg.) that can handle the complex unit processes/operations by providing you the best analytical solution for your processes.
Written by,
ParthPrasoon Sinha
Sr. Data Scientist
Tridiagonal Solutions
- Published in Blog
Hail Machine Learning Models, but sometimes you’re Precarious!!
Good morning, good afternoon or evening to all. Pick the one which belongs to you!
So, before we get to the centerpiece of the article, just want to set some context. The focus of this article is not too technical, nor too generic, but this article is dedicated to all among us who in some way or the other is related to the field of digitalization in the manufacturing industry.
Sometimes we are too much taken by the technicality of the problems, that we stop thinking about it in a crude engineering way. Don’t you feel so?
Sometimes, it’s suitable (and a need too!!) – to rethink the objective and solve it by taking a logical approach, indeed a practical one.
Have you ever felt that, with the advent of the technology (ML and AI I mean!) we try to force-fit the models everywhere without any proper definition and evaluation of the requirements, needs or investments (ROI, in other words). But still not clear, right?
A fun fact, though I do not hold any statistics on this one, I still feel that – “The rate of an engineer transforming to a data scientist is higher than that of literacy rate itself.” Do you agree?
But, are we really making any practical use of this transformation? It’s an observation, that before we apply any model to the process data, we force ourselves to think like one, right? So we miss out on the logical apprehension or the practical mindset that goes behind it.
Hail Model! That’s right. Machine learning and AI have definitely empowered us to solve many engineering problems in any easy and comprehensive fashion, such as – Real-time predictions of the quality parameters, forecasting the next probable failure event for any asset(s), and many more. It has democratized the Industry in many ways, by detaching the long going dependency on the lab analysis in many operations, dependency on simulations to get the inflicting values of the quality parameters and many more. It has drastically reduced the time for getting the results much earlier, almost in real-time, which earlier took days to get generated from other siloed mechanisms.
But do you really think that these can solve all of your problems? No, right? Moreover, sometimes the infrastructure and technology cost behind such an application is huge, even more than ROI itself. So what should we do? Should we stop thinking about these applications? Or, should we wait till this cost plummets. The answer is a “No”. Then what should we do?
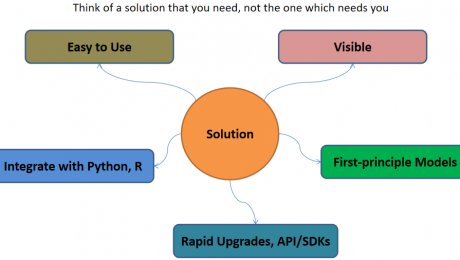
There needs to be a logical approach behind these, which means that someone has given us the power to use the technology, but how to use it, is up to us. In this case, the driver of the technology or the digitalization leaders have taken ownership of such programs. He/She should be well versed with the technology targeting the manufacturing industries. Plethora of solutions are available, so which one to select? This is the next big question, which connects our previous one. So the answer is that the solution should be such easy to use that even the operators or the engineers can learn it. Right? I mean what’s the use of such technology that doesn’t make your life easier. Correct!!
So, coming directly to the solution part, the evaluation criteria or the metrics to keep in mind, before investing, but after envisaging the requirements and need:
- Comprehensible: Simple, easy-to-use solutions – that can get into the hands of operators and engineers (The real industry drivers!!)
- Blend-able: Capability-wise – Easy to mingle with the open-source and widely accepted programming solutions, such as python, R and MATLAB
- Reform-able: Solution should be capable enough of upgrading itself with the uplifting of the technology. Or else, it will get outdated soon. This becomes a really important criteria as one always invests in keeping long-term goals in mind, and not the short ones.
- Visible: The solution should be capable of providing Visuals – be it in terms of trends in real-time or 3D CAD models, like the one in digital twin, which we all dream about.
- Though we say models are a black-box, we still want to see what it is doing, right? At least, what is it outputting? Operators don’t care about which model you apply or what technique you use, then just want to see what is happening inside that piece of equipment with a better view, that’s it.
- Solvable: We all are engineer’s correct? We want to solve equations and correlations, it’s our job. So the solution should be capable enough to allow you to solve some complex algebraic equations – we call it first principle models.

In case you are starting your digitalization journey or being stuck somewhere, we (Process Analytics Group) at Tridiagonal solutions can support you in many ways.
We run the following programs to help the industry along with various needs:
- We run the POV/POC program– For justifying the right analytical approach and evaluating the use cases that can directly benefit your ROI.
- A training session for upskilling the process engineer – How to apply analytics at its best without getting into the maths behind it (How to apply the right analytics to solve the process/operational challenges)
- Python-based solution– Low code, templates for RCA, Soft-sensors, fingerprinting the KPIs, and many others.
- We provide a team that can be a part of your COE– That can continuously help you to improve your process efficiency and monitor your operations on regular basis.
- A core data-science team (Chemical Engg.) that can handle the complex unit processes/operations by providing you the best analytical solution for your processes.
Written by,
ParthPrasoon Sinha
Sr. Data Scientist
Tridiagonal Solutions
- Published in Blog
Connected Analytics for Sustainability in Refinery Operations
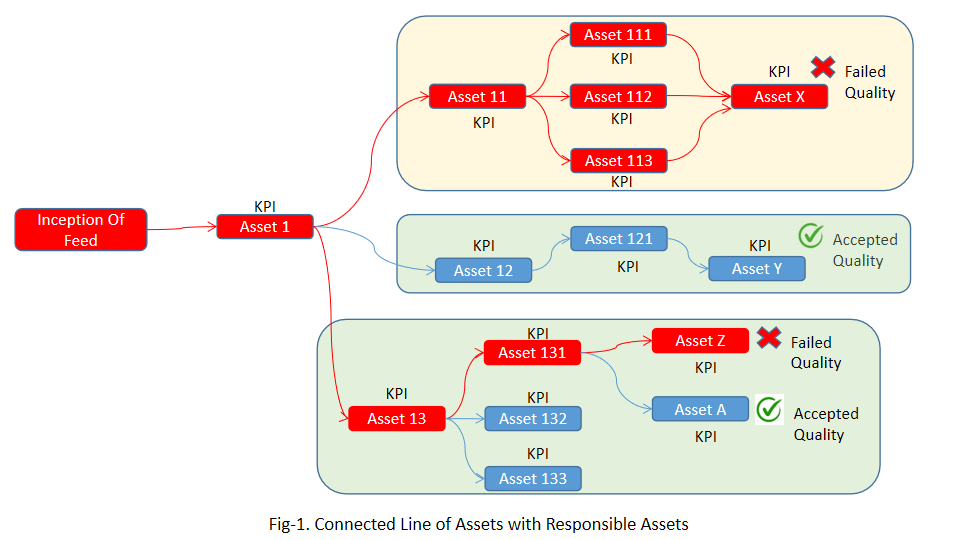
With the advent of Technology, Oil and Gas Industry has transformed itself to adapt the best of analytics practices to extract maximum profit, without much expense at the productivity losses. Where, analytics practices include the use of Machine Learning/AI, Hybrid Modeling, Advanced Process Control (APC) and APM to mitigate the existing challenges of production losses, optimization, asset availability and sustainability. For the interest of this article our focus will be more towards achieving Sustainability through advanced analytics approach. Today, Oil and Gas industry is investing heavily to achieve its sustainability goals, through various programs to avoid unplanned downtime, reduce the losses, optimize the raw material, or to even control the COx, NOx, emissions to bring down the global adversary impact of green-house gases on the environment. To support the sustainability programs across industry in a more methodical way, we introduce the concept of ‘Connected Analytics’. Connected analytics, although being a relatively new terminology for manufacturing industry, is a more pronounced terminology in the area of Product Lifecycle Management (PLM), which goes by the name of ‘Digital Thread’. Connected Analytics borrows the core underlying idea in the Oil and Gas production space to support various analytical activities.
How?
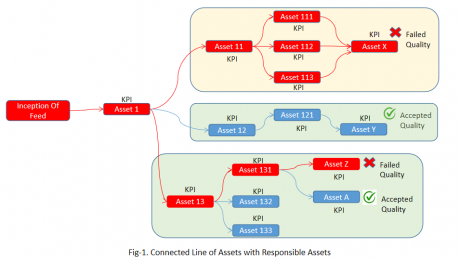
Most of the engineer’s time is spent in troubleshooting the process to maintain their KPIs within the range. This process is time intensive and points to significant losses in production and monetary savings till the operation converges back to its normal condition. Each refinery operation is associated with large number of process variables, which at the time of troubleshooting makes it difficult to control and identify the responsible parameter that caused the anomaly. For such colossal operations with plethora of process parameters, we use ‘Connected Analytics’. Connected Analytics could be understood as the Nexus of Assets/Processes arranged in the order of their place/position in Industry. Today, we spend lots of lime to perform asset level analytics, but what if the quality failure in a specific asset is the outcome of it precursor assets? This has a broader picture to conceive, as we usually do not consider the information of the antecedent processes in terms of failures or anomaly. To mitigate this industrial pain, we introduce P&ID like “Bird’s Eye View” kind of visualization that considers all the interconnected assets, along with an eye on their critical parameters in real time. But to realize profits from such a level of advanced analytics and advanced visualization, industry needs to achieve some predefined level of digital maturity in terms of advanced modeling, softsensors,.etc. Once the prerequisites are set, engineers/operators can have the real-time dashboards for soft-sensors/first-principle driven KPI alongside its assets in the Connected Analytics view to monitor the operations more efficiently.
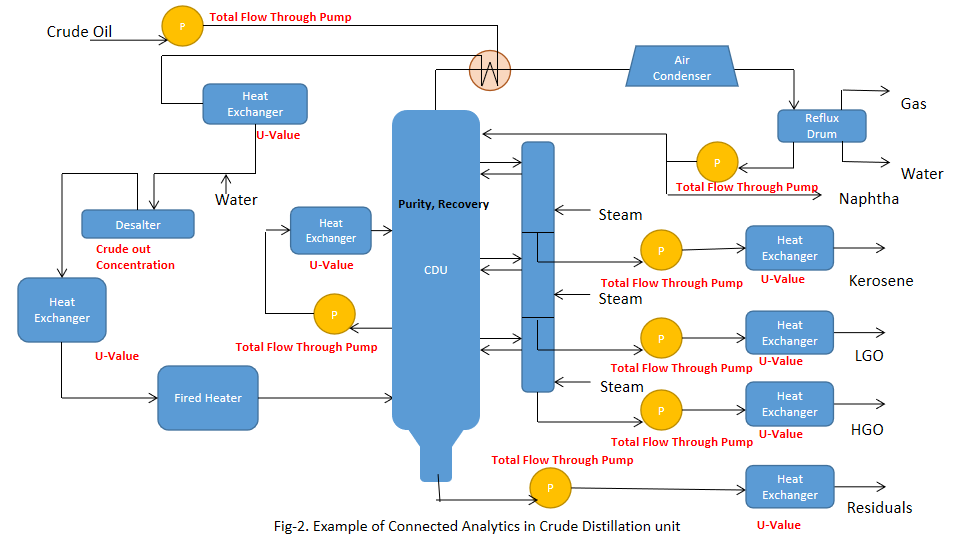
Written by,
ParthPrasoon Sinha
Sr. Data Scientist
Tridiagonal Solutions
- Published in Blog
- 1
- 2
