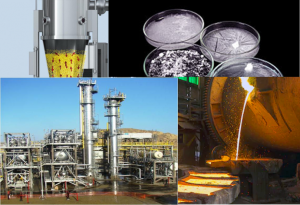
Root-cause Analysis for Fault Detection

Challenge:
- Large number of process variables makes it hard to identify the KPIs which are responsible for any deviations or excursions in the process.
- Delay in realization of any excursion from the point in time when it happened.
- Monitoring becomes difficult for the operations which involve large number of variables
- Lack of knowledge about the correlated parameters
Dataset:
- Real-time process data, Batch and continuous operations
Modeling approach:
- Principal component Analysis to perform the root cause analysis, and identifying the critical parameters
- Extending the PCA, using t-score plots to realize any anomaly in the operations
- Time domain analysis to identify any deviations using the concept of Hotelling’s T2 plot
Output:
- Hotelling’s T2 plot enables the operator to take corrective actions against the identified deviations in near-real time
- The dimensionality reduction technique helps the operator to focus on the important process variables that contributes maximum to the variability of the operations
Written by,
ParthPrasoon Sinha
Sr. Data Scientist
Tridiagonal Solutions
- Published in Blog
Sequence model in Oil and Gas Industry-Downstream

What is sequence modeling?
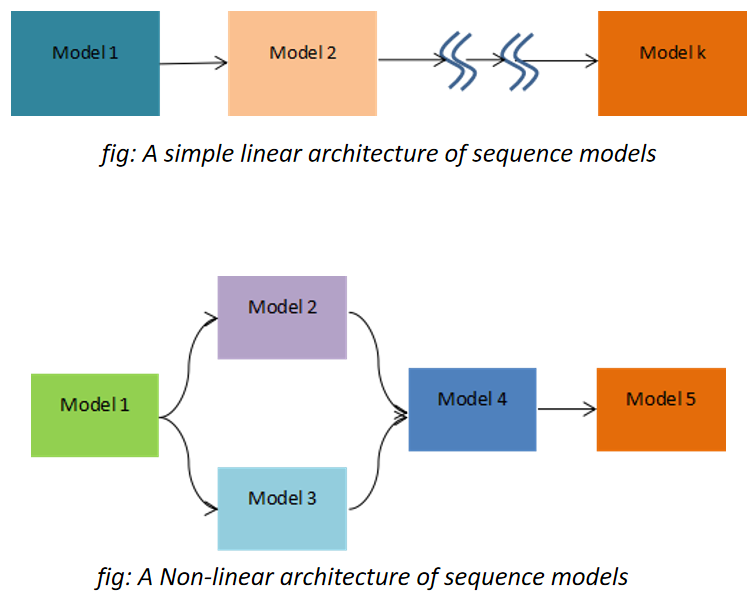
When output from one model is fed as a part of the input in the other model for prediction purpose then we call it as a sequence model. This concept arises when there are more than 2 or more parameters which you want to predict simultaneously. This idea indirectly also indicates something about causality relationship between the inter-parameter relationships. This means that which parameter needs to be predicted first should be pre-determined and similarly for the other parameters. The sequential model outputs should be representative of how the operations or the process happens in the real time. When we speak about causation we mostly think about the manipulative and the controlled variables and not the responding variables in the “Line of action”. But what If there are more than 2 parameters which could be treated as responding variables in the process and you don’t know which one to predict and use it as a final metric. Under such circumstances we can use the sequence model and try to predict one of the responding variables first as a function of the independent parameters and then use this as the input to the other model. The architecture of such model could be very simple as a linear chain or could be as complex as a network of blocks.
And When Sequence Modeling?
This approach could be applied to all such processes where one outcome could be somehow transformed and utilized/consumed as an input in the other model. In does not necessarily mean that in the real practical scenario the outcome from the first is responsible for the outcome from the second model as being a data-driven approach, its volume and variability plays a vital role. A good example to understand this could be through its implementation on the connected processes in the downstream operations, where pump is connected to distillation columns, then re-boiler and condenser in parallel and so on. This process clearly indicates that the output from the pump will surely impact the distillation performance and the other successive process, which makes a complete sense to implement the sequence model here so that the performance of the entire process line could be gauged in a single thread of analytics with multiple knots, identified as a model. So here the first model will be for pump that will predict the output parameter which will be the input for the next operation which is distillation column, and from here two discrete models will run in parallel, one each for re-boiler and condenser. The representation of this entire non-linear modeling plane could get visualized in a single dashboard, where each box could represent a unit –operation/process.
Many a times it’s possible that your responding variables are not directly associated with each other, but the nature of data over time brings a reason for you to utilize this concept. Yes it happens!! The behavior/trend of the data could also be used to identify and arrange the output parameters in the models sequentially. One such use case could be when your controller is really a bad performer (Meaning that you are mostly off-spec and at sub-optimal operations). Always you see a huge difference in the set and the real indicated values. In such cases you can try to create a ML/AI model (First model) that uses the independent process parameters to predict the real values, and then this predicted real value can be used in a second model that predicts the set value as the output. Essentially it prescribes the engineer by telling him what value to set next, by mapping the process and the controller non-linear behavior.
Written by,
ParthPrasoon Sinha
Sr. Data Scientist
Tridiagonal Solutions
- Published in Blog
When, why & how should you Monitor the Assets?

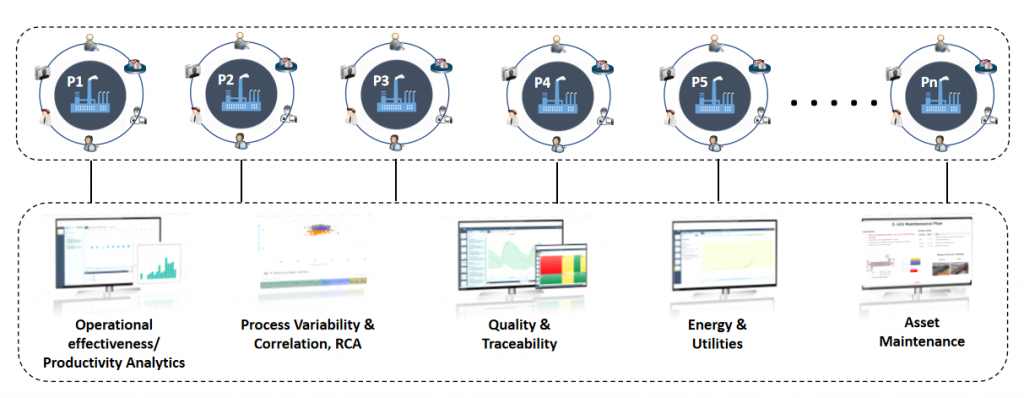
With this article we will try to establish our understanding around when, why and how monitoring the assets can solve the business problem. Monitoring the assets or prognostics analytics seems to be very widely used technique, which has been accepted across many Oil and Gas industry. When we say “Monitoring”, a direct implication could be – Monitoring the process parameters or the important KPIs for the Assets.
But wait a second, if we do not have the KPI readily available from a sensor then? How can we derive a metric that can aptly be utilized for making our analytics possible in real-time. Are there any techniques available?
One big challenge that pops-up when we are trying to solve the process related asset is that no single parameter dictate the behavior of the entire process, instead it’s the combination of multiple parameters. This arises due to the fact that there are multiple unit processes going on in the equipment, which attributes to large variability in the system. So a key insight from such process is that, there lies a significant possibility of having a multiple operating conditions(combination of them) where your process may diverge or converge.
So how can we address such challenges?
Lets take a step by step approach to understand this.
When Monitoring
Monitoring becomes a prominent approach when we are looking into the real-time variability analysis, but what signal to monitor, comes either from SMEs or through applying advanced ML/AI models. Advanced ML (supervised or unsupervised) helps us to identify the important KPIs depending upon the behavior of the data. The signals that these model predict are also known as ‘Soft-Sensors’, which is derived using the unified approach of data-driven techniques and science. One observation with the Assets, which are “industry enabler’s” is that they have established itself to the point where we know the KPIs with a strong conviction. Which means that, monitoring these specific parameters will be sufficient enough to estimate its performance. But there are assets for which the performance is heavily governed using the process reactions, mass transfer, heat transfer..etc, which makes it difficult to identify the KPIs that would dictate the process. In such cases monitoring wouldn’t help if you are bereft of the critical parameters.
This makes sense right? As monitoring will only help if you know what to monitor!!
So, for process oriented assets we still have more to explore to establish the right metric for identifying the KPIs. By making use of the soft-sensors modeling techniques one can create the KPIs that we can monitor in the real-time. For more information on how to make the best use of soft-sensor please have a look into my earlier blog on soft -sensors.(See below)
Why Monitoring
Monitoring always helps you to maintain your process deviations and abnormalities in control, if you know what to monitor. In recent advances it has seen a huge potential – Increasing your ROI just by monitoring your assets. But as discussed monitoring is more reliable where the undergoing process is fairly simple and we know what signal to monitor to improve your process performance. This kind of analytics is heavily used for assets such as pumps, compressors, heat exchangers, fans, blowers..etc. And since predicting the failure of such assets beforehand can surmount the production losses and inefficiencies in the downstream processes.
Similar kind of philosophy goes behind the processes with the only challenge being that you should know how to derive those KPIs (Which is to be monitored). Today, industry rely heavily on lab analysis for quality check in the product stream, or depends totally on equipment such as gas chromatography..etc to check the efficiency of the separation (Just an example). But due to the advancements in the technology and computational capacity, we can work on those historical data from lab (quality data) and create a workaround for modeling the soft-sensors (Derived KPIs-Refer my previous article on soft-sensors). These soft-sensors enable the engineers to detach their dependencies from the lab analysis and monitoring equipment.
In short, the mathematical model looks for its suitable and applicable place to help the operator by letting him get rid of the old techniques. Moreover, this way your dependencies on the first principle models also gets reduced to some extent, otherwise this was the only source of reliability earlier. More justice to such new techniques could be done if the data collected is sufficient enough, with not much expense on the data integrity. (See below)
How Monitoring
How monitoring can solve your business challenges? Good question, isn’t?
So let’s understand first how the outcome of a data analytics use case is consumed in the industry. The operator/engineer looks for a solution which is comprehensive to him and speaks the process language, which is compilation of the entire analytics in a single screen. This is also known as a dashboard, a dynamic dashboard more precisely. There are tools and platforms available that can easily load your indicators and update it in real-time. This solution also keeps the actual environment of the analytics/code separated from the operators so that they can focus more on the consumption part, rather than focusing on how this analytics was created. (One such known solution is Seeq, which can take care of performing the analytics and then publishing the content in a dynamic dashboard for operators)
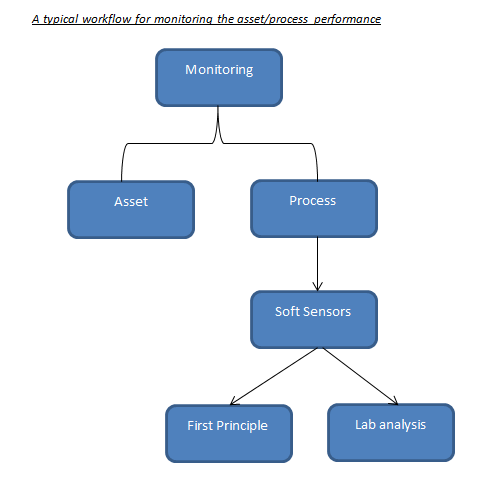
Explained with a use case: Distillation column
In this case our objective was to predict the column vapor pressure and the important KPIs, which is mostly done through lab analysis today. Before we move ahead, let us see the list of tags that were collected:
1. Temperatures for Distillation Column and Re-boiler (Real time Process Condition)
2. Pressure (Real time Process Condition)
3. Flow rates (Real time Process Condition)
4. Vapor Pressure (Lab analysis)
3 years worth of data was collected with a sampling rate of 5 mins.
Note: Data sanity check was performed before applying the model for creating the soft-sensor.
For the interest of this article our focus will only be the soft-sensor which we will be monitoring in the real time to observe the performance. Please note that the KPIs which were identified should also be monitored to keep the deviations in the operations under limit to improve the controller actions. But since the direct parameter to monitor the quality is the soft sensor, so we will keep it in the lime light.
Steps:
1. The vapor pressure data was regressed against the process parameters using random Forest model
2. GridsearchCV was used to tune the hyper-parameters for achieving the maximum accuracy
3. The model was trained on 2.5 years of dataset and the rest was used for testing purpose
4. The reliability of the trained model was check for its consistency on the multiple shuffled dataset. The
standard deviations in the model metric was checked to evaluate the robustness of the model and it’s predictive
power
5. And finally the predicted signal or the soft-sensor was used on the production data for real time predictions
I really hope that this article helped you to benchmark your strategy for deriving the right analytical strategy in your Industrial Digitization journey. For this article our focus was on monitoring the right KPIs – soft-sensors for your process driven Assets, and stay tuned for more interesting topics.
Who We Are?
We, Process Analytics Group(PAG), a part of Tridiagonal Solutions have the capability to understand your process and create a python based template that can integrate with multiple Analytical platform. These templates can be used as a ready-made and a low code solution with the intelligence of the process-integrity model (Thermodynamic/first principle model) that can be extended to any analytical solution with available python integration, or we can provide you an offline solution with our in-house developed tool (SoftAnalytics) for soft-sensor modeling and root cause analysis using advanced ML/AI techniques. We provide the following solutions:
- We run a POV/POC program – For justifying the right analytical approach and evaluating the use cases that can directly benefit your ROI.
- A training session for upskilling the process engineer – How to apply analytics at it’s best without getting into the maths behind it (How to apply the right analytics to solve the process/operational challenges)
- Python based solution- Low code, templates for RCA, Soft-sensors, fingerprinting the KPIs, and many others.
- We provide a team that can be a part of your COE, that can continuously help you to improve your process efficiency and monitor your operations on regular basis.
- A core data-science team (Chemical Engg.) that can handle the complex unit processes/operations by providing you the best analytical solution for your processes.
Written by,
ParthPrasoon Sinha
Sr. Data Scientist
Tridiagonal Solutions
- Published in Blog
Soft Sensor – Intelligence to Operationalize your Industry – Oil & Gas

What is Soft-sensor?
Soft-sensor is a fancy term for the parameters which are derived as a function of the sensor- captured parameters. These could also be termed as “Latent Variables”, which are not readily available, but is required as a key metric to estimate the process/asset performance.
Why Soft-sensor?
As said above, soft-sensors are the the key metric that dictate the efficiency and performance of any process or the asset. The evaluation of these parameters become a necessity when monitoring the real-time performance of the system and enabling the future predictions for failure preventions and performance assessment.
How to derive a Soft-sensor?
This question becomes important in-order to devise a right metric to derive the soft-sensor. These parameters could either be estimated through data-driven techniques or through first principle models. Typically, we leap through the following steps to generate a soft-sensor:
- Select/Evaluate the right soft-sensor which is required to estimate the performance
- Gather all the required constants or the sensor signals which will be required to develop it.
- Look for the possible ways (Data-driven/Mechanistic) to evaluate it
- Test it in the production environment, and estimate it’s direct inference in the real-time operations
- If satisfactory, then use various forecasting rules/techniques to estimate the performance in the successive events
Soft-Sensor in Oil and Gas Industry
Soft-sensors has recently observed a lot of attraction in Oil and Gas industry. It’s been used heavily for assessing the performance of the industry enablers/assets such as Heat Exchangers, pumps, compressors…etc. Deriving such parameters becomes hard when we try to implement it in a process which is heavily governed by the first-principle/mechanistic models. This also brings in the requirement of integrating those models into the analytics workspace for a convenient and reliable analysis.
Let us look into the two different scenarios(Use cases) where we will be using soft-sensors derived through 1) Advanced Machine Learning Techniques, and 2)Mechanistic Techniques:
Use case I:
Debutanizer column performance prediction:
For debutanizer column performance is dictated by the extent of separation that happens to obtain a high purity C4 fraction from the tops as LPG (gasoline is obtained as the bottoms).
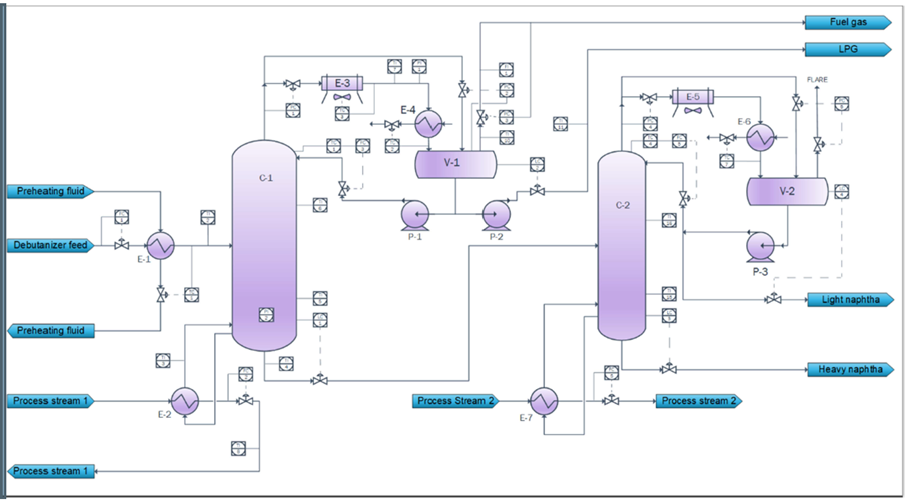
This image is taken from https://modeldevelopment.thinkific.com
The challenge with this process comes when the gas chromatograph which is used for real time monitoring of the C4 fraction in the stream is off-due to maintenance. Such situation handicaps the operator/engineers to qualify the process performance. The lab analysis for estimating the quality of the product takes a while(few hours) to verify the process performance that happened in the past. This shows that gas chromatograph becomes a necessity to evaluate the process performance in real time, but due to its own maintenance challenges it brings in a major requirement to replace it with the possible mathematical model that can operate for all time without any operational failure in it’s own. This mathematical model can also be a potential replacement for lab analysis if developed with all the required parameters and assumptions.
For this process the sensor available data includes flow-analyzer, temperature, pressure from various controllers in the set input stream.
A machine learning model could be utilized to establish a model between C4 fractions from the lab and the sensor parameters by capturing the inherent linear/non-linear behavior. The predicted model in comparison to the actual C4 value could be seen in the figure below:
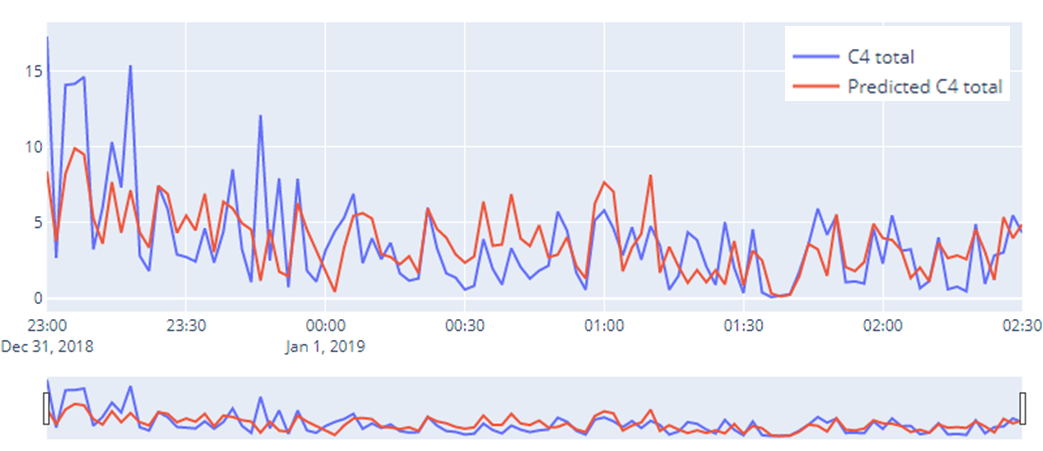
This approach becomes very important because Oil and Gas industry is heavily dependent upon the separation technologies, primarily the distillation column. If utilized properly, then most of the operations can be automated in-order to bring about efficiency in the process, and also in terms of the incurred production losses.
Technologies such as ASPEN can also be utilized to generate the synthetic data, which can be used to develop the model. Then it also opens-up the gateway for modeling the soft-sensor for variability estimation in the input stream such as composition changes, temperature deviations, and many others. A whole network of the process can be viewed and analyzed using our “Analytics Thread” approach, that can identify the precursor failures/abnormalities with respect to the subjected process.
Use case II:
Compressor Modeling and performance prediction:
Monitoring equipment such as compressor, heat exchanger and pumps becomes important as they are many in numbers and failure of one such asset can stop the successive production events, which can cause huge monetary losses. The only task of such equipment is either to enable the industry with required and necessary flow, or to maintain the stream with the required Temperature and Pressure.
Due to continuous flow of the oil/water streams(impurities) through these assets, corrosion/scaling/fouling becomes a major process challenge that can bring down it’s life cycle and reduce the performance eventually.
The challenge with compressor performance monitoring is that the only available sensor data is its suction and discharge pressure and temperature, which is not sufficient enough to estimate its efficiency. We need to bring the thermodynamic part of the intelligence to the analytics layer. Right, the thermodynamics model which in this would be isentropic path exponent, polytropic path exponent and efficiency, power equations, ideal gas law, compressor chart for discharge pressure and power…etc.
Although these parameters are not available in real-time basis, but these mechanistic model/equations can be integrated in the analytics layer to enable it’s calculation in the near real-time.
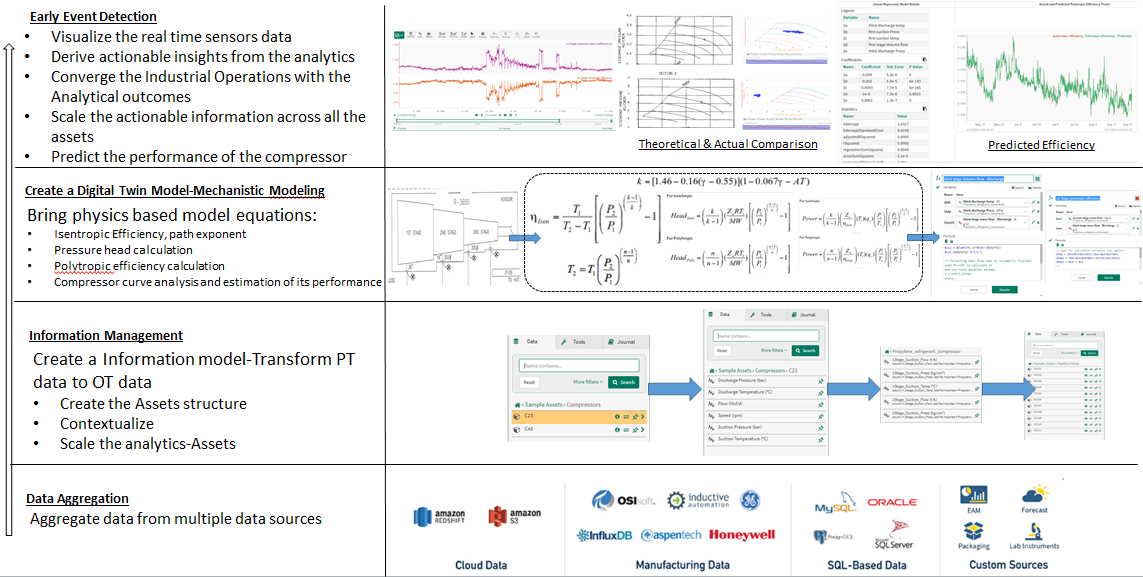
This use case was developed in seeq platform
Once these equations are ready, we can layer the prediction model on the training dataset to create a model that is purely the function of the sensor recorded data, by capturing the highly complex/non-linear behavior of the system. This way one can reduce the computational cost that went behind these set of calculation for every new data received.
Innovate your Analytics
I really hope that this article helped you to benchmark your strategy for deriving the right analytical strategy in your Industrial Digitization journey. For this article our focus was on soft-sensors, stay tuned for more interesting topics.
Who We Are?
We, Process Analytics Group(PAG), a part of Tridiagonal Solutions have the capability to understand your process and create a python based template that can integrate with multiple Analytical platform. These templates can be used as a ready-made and a low code solution with the intelligence of the process-integrity model (Thermodynamic/first principle model) that can be extended to any analytical solution with available python integration, or we can provide you an offline solution with our in-house developed tool (SoftAnalytics) for soft-sensor modeling and root cause analysis using advanced ML/AI techniques. We provide the following solutions:
- We run a POV/POC program – For justifying the right analytical approach and evaluating the use cases that can directly benefit your ROI.
- A training session for upskilling the process engineer – How to apply analytics at it’s best without getting into the maths behind it (How to apply the right analytics to solve the process/operational challenges)
- Python based solution- Low code, templates for RCA, Soft-sensors, fingerprinting the KPIs, and many others.
- We provide a team that can be a part of your COE, that can continuously help you to improve your process efficiency and monitor your operations on regular basis.
- A core data-science team (Chemical Engg.) that can handle the complex unit processes/operations by providing you the best analytical solution for your processes.
Written by,
ParthPrasoon Sinha
Sr. Data Scientist
Tridiagonal Solutions
- Published in Blog
Devising your deployment strategy-ML Model

This article should help you to set a benchmark for how to decisively deploy ML/AI models considering your investments to be in the right software infrastructure/architecture/platform, guiding all through your journey of manufacturing analytics. Deployment of any model is a strong function of the data stream including its quality – Accuracy, completeness & consistency (Covered in earlier article) and volume, sampling rate and its ultimate end-objective that will decide on how the end user is going to consume the analytics output.
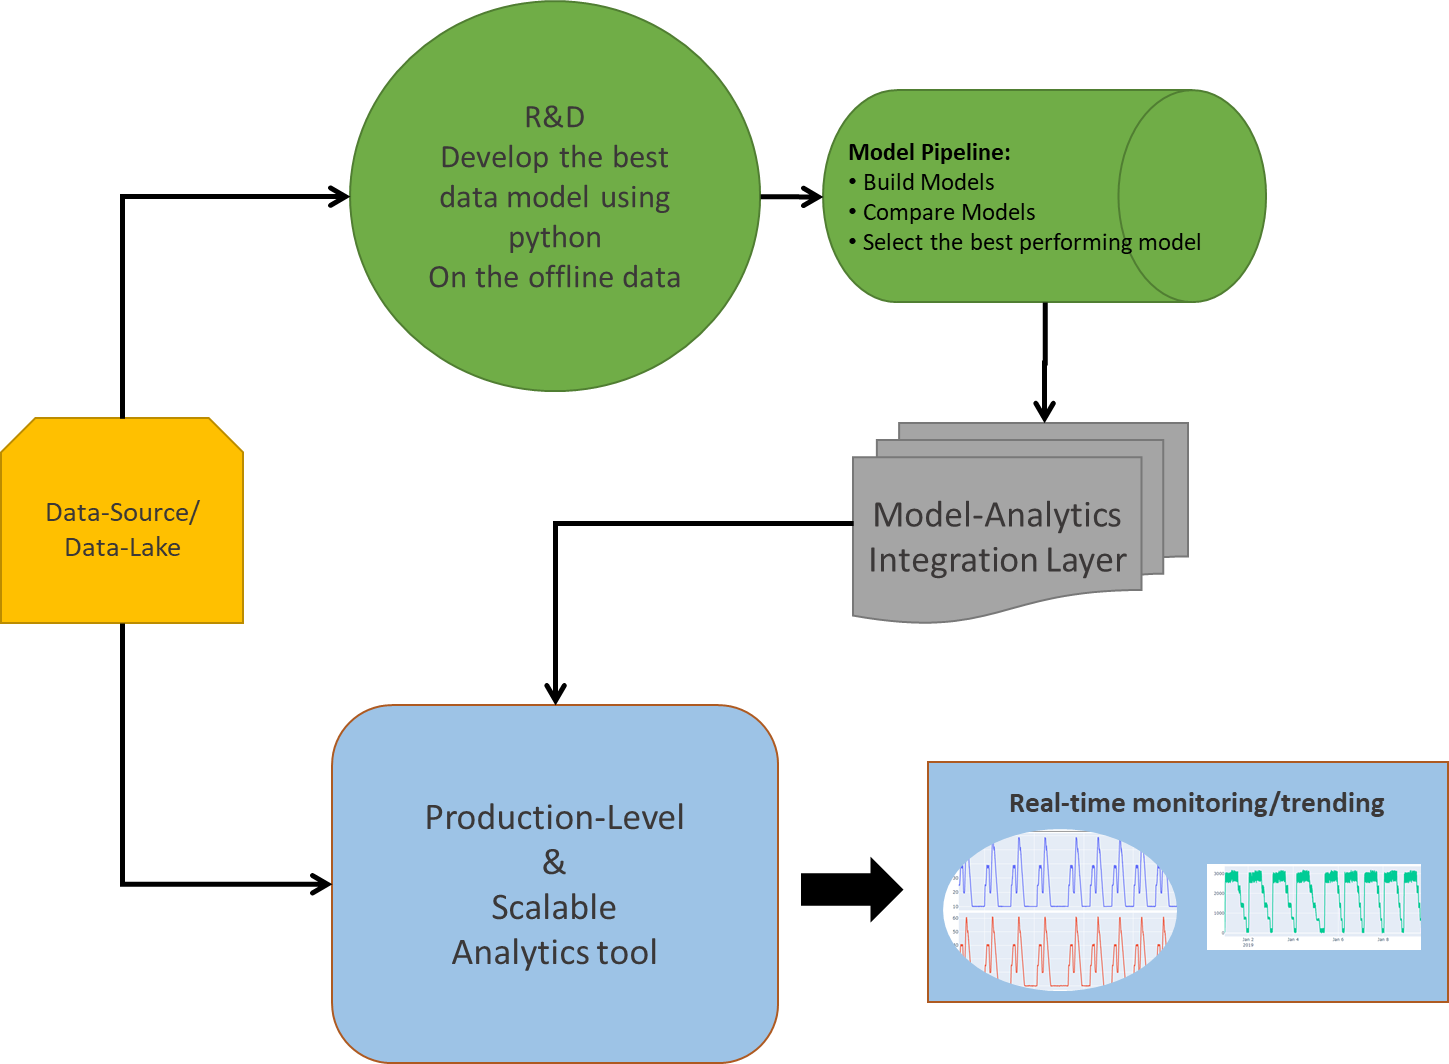
Fig: Deployment of ML/AI solution-Architecture
A major challenge for any deployment solution lies in its CAPEX and OPEX that goes behind developing the environment/infrastructure ready for analytics at site. This concludes not only with a huge investment in building data infrastructure (Eg-process historians/data-lake for big data storage, processing and analytics), but also keeping the one updated (Integrated) with the newest possible technology around the world for better performance.
Let’s get into a detailed understanding about various options and a few challenges in deploying the right analytics solution.
Deployment Options:
When it comes to the deployment of any analytics solution, we need to be selective about “how the end-user is going to consume its output?” or in simple sense harvesting your Analytics.
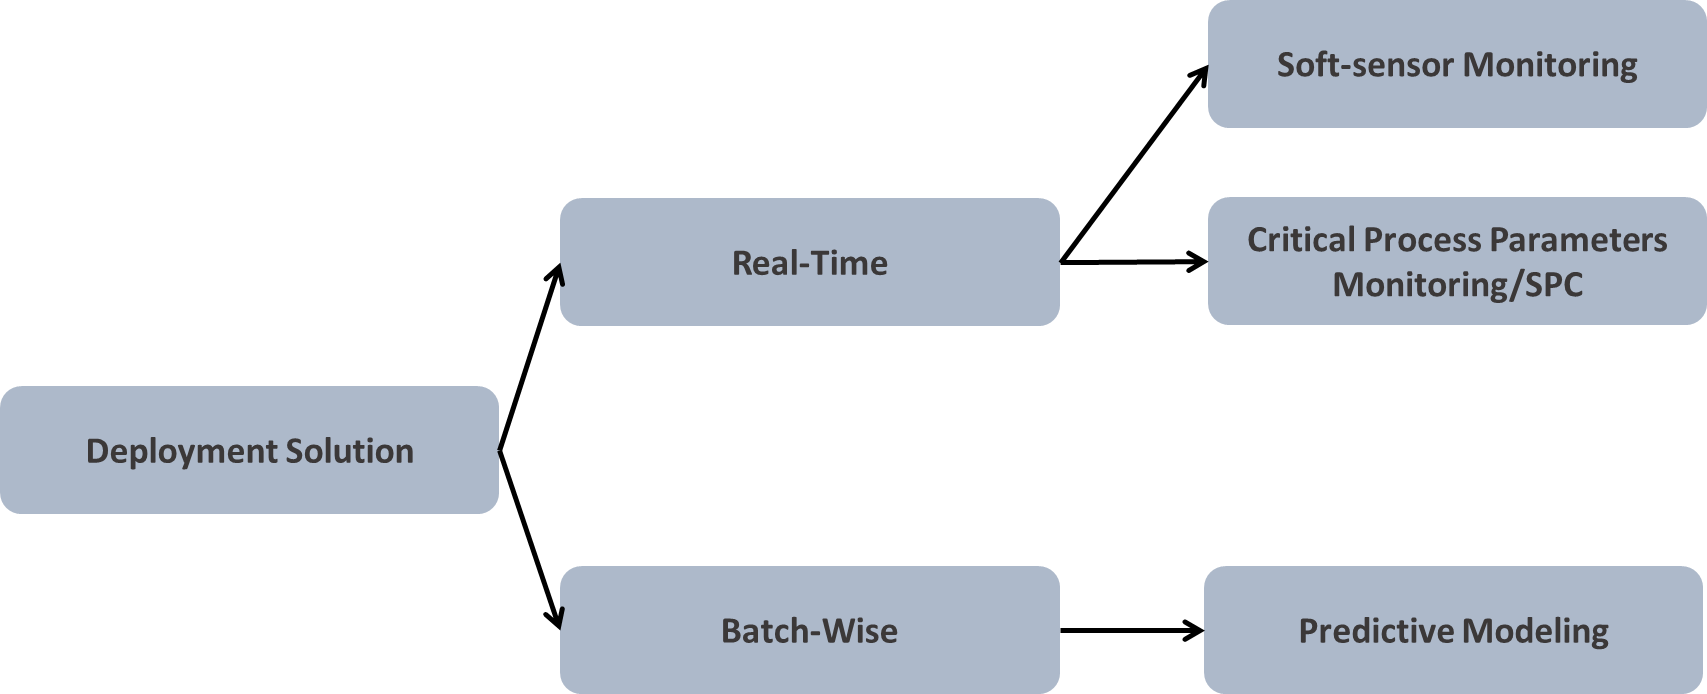
Fig: Kind of deployment (1)Real-Time, (2)Batch Data-wise
The answer to the above could be either visual analytics or predictive analytics using soft-sensor modelling, if feasible or by predicting on the batch of the dataset. Visual analytics can sometimes speak more about the uncertainties/abnormalities if the underlying dataset is a good representation of your operational strategy.
Real-time model deployment is not always feasible due to many of its limitations. Training-cross validating-testing the model is a time intensive and expensive task. At this point you may have a question in mind, “What if soft-sensors signal is created”? This is a pretty intuitive question (Assuming that most of the manufacturing analytics will involve regression model over classification tasks). So, in-order to set a context here, I will say, yes you are absolutely right!! One can create a soft-sensor signal to monitor the real operations, but only with a few limited models out there. Not all models will give you a regression line equation for building a soft-signal. For Eg: Random forest will enable you will the prediction, but being a tree predictor in its core, it won’t give you the regression coefficients for the parameters. And similar kind of behaviour is expected from many other ML/AI models. On the other hand, if you’re building a linear regression or polynomial model, it will give you the predictor’s parameters, which you can copy and build a corresponding soft-sensor for real-time calculations.
Many a times, it’s being observed that identifying the Critical Process Parameters and creating a statistical limit around it will give us a better outcome. For Eg: After applying a regression model you should be able to estimate the important parameters for prediction, upon which you can create a statistical limit of let’s say, ±1 or 2 σ for controlled operations (Assuming that the defined statistical limits are validated and tested on the real dataset).
One platform-scalable solution:
Selection of the right platform, which is scalable across all of the assets and processes, is required for efficient analytics in the production environment. To retain maximum fraction of the investments and benefits from your analytics a single solution/platform should be identified that provides you all the capabilities without much limitation. There are a few key capabilities that you should be looking for before selecting a platform,
- Easy and intuitive solution
- Should be able to handle most of the analytics requirements
- Should easily connect with multiple data-sources/data-lake at a single place
- Data connectivity to the real-time should be quick, without much delay
- Should be capable of performing data cleaning functionalities
- Capable of creating the soft-sensors/advanced mathematical operations
- Advanced visualizations
- Functionalities such as SPC/hidden pattern search/deviations should be packaged
- Should come with modelling capabilities, by enabling easy integration with python/R/Matlab programming languages.
- Provide a dashboard view (dynamic/static) for higher management, to enable them with easy decision making power.
- Above all, the analytics performed on one asset should be easily scalable across all the other assets.
R&D V/S Production Scale:
When it comes to the Production scale, the deployment of the analytics is limited by various elements such as, the databases, whether time-series or SQL, modelling capabilities, whether Python or R, the platform architecture, whether light environment or not. All of these functionalities should be considered in mind before deploying any architecture.
One key thing that we might miss out easily is that the platform should have the capability to provide the output in various formats, considering the end-user. It could be for operators, or for the engineers, M&ST team, operational intelligence team, or the higher management.
On the other hand, python being a fantastic modeling environment requires a lot of coding and modeling experience, which is not feasible for all the users. Although it’s pretty good choice for R&D level of analytics, where the user himself is expected to code-compute-create-model and consume the output of the offline data analytics. Also, modeling in python requires many other dependencies/packages which aids in fast coding, but at the expense of the processing power and speed. Its most suitable for the user who wants to try and check many new models out there in the market to compare its performance with the existing models.
Assuming a modeling project, to streamline the idea of scalability, one must starts with modeling in the python environment and then somehow transforming its outcome into the analytics platform by either creating the soft-sensors or estimating the important process parameters and layering the limits over it. One other approach could be to train and validate the model on the sufficient offline dataset, and then from time to time test the model on the newly generated dataset to check its predictive power and estimate the outcomes, and if required go back and tune the model parameters until you get a satisfactory result with maximum accuracy.
To conclude, python should be selected, only for the research oriented modeling projects and not for the production level (deployment) analytics. Moreover, many new and existing technologies are available that provides to us with an easy python/R/Matlab integration capabilities within themselves, such as Seeq-To which you can write down your python scripts in Seeq Datalabs (Similar to jupyter Notebook) and model on the choice of data that you are connected with.
- Published in Blog
Need for Cleaned Data At Place (CDP) for performing efficient Process Data Analytics — Volume of Data


In this article (3rd in series) our focus will be primarily on the necessary and sufficient volume of the data that will be required for efficient process/manufacturing analytics.
Few questions that should come to your mind before applying analytics:-
- Why volume of data is important to fulfil your analytics requirement?
- How to determine the required volume of data beforehand?
- What are the data attributes that link to your data volume requirements?
The answer to all such questions lies in the process/operation you are dealing with. By all means, the data should be a good representation of your process. It should speak for your process variability, process operations strategy, and everything that helps in understanding the process. Metadata, which is an excerpt of your data, should give you a salient insight about the process parameters and it’s operational/control limits. It should also give you sufficient information about the good/bad process, which ultimately dictates your product quality, be in terms of poor yield, rejected batches..etc. This information is very much important for developing the model in the later stage, where it needs to get trained on all the process scenarios that data can represent. For Eg: Your model will be capable of predicting the rejected batches, only if the data that was fed to it carried that information in itself.
Two Key important attributes for validating your data is:
- The amount of data(Identified using the start and the end duration of the data)
- Sampling frequency
The amount of data

The answer to this is dependent on the kind of analytics you are interested in, such as predictive, diagnostics, monitoring..etc.
Monitoring: This kind of analytics requires near-real data, which needs to be controlled. The statistical limit to the identified signal is assumed to be estimated beforehand, either using using SPC, or it should come from the SME know-how.
Diagnostics: This layer of analytics is function of the historical data (minimum volume) that can give you the estimation of process variability. Identifying the parameters that can associate significantly with your product quality or output parameters. Sensitivity analysis of input space on the output parameters needs to be checked to validate the critical process parameters. Typically, 2-3 yrs of data is required to perform this analytics in process industry.
Predictive: The model developed in this stage is trained on the dataset, which assumes that the provided datset gives all the underlying information about the process. This also means that dataset must be carrying the important information about the uncertainties and abnormalities that happened in the past for efficient prediction. An important thing to note here is that the model will be able to predict all the scenarios of the process, it has learned (trained) from past using the historical data. If some uncertainties were missed out during the training the model, then again re-validation of the data, re-training of the model, tuning the model will be required. More and more data will give you a robust model, with better predictability. A minimum threshold of data, after which the model performance doesn’t vary significantly, should give you the right estimated volume of data.
Sampling Frequency

This parameter plays a very important role in analytics. The correct sampling frequency should result in a dataset which represents your process operations accurately. Maybe, with a higher sampling rate you miss out some important process information which could be critical for the model to understand for making better predictions. Dynamic and rapid operations can require the data to be collected at higher frequency (every 1 sec or 1 min). The collected data should be stored with minimum latency to a high performance database, for it’s efficient use in the analytics later. The performance of the database could be estimated using it’s data compression, asset structuring capabilities. It’s preferred to use Time series database (process historians) over SQL database for scalable and optimized analytics.
Conclusion
Both volume of data and sampling frequency plays a vital role in process analytics:
- Right volume of data should give justice to your model. Recommended approach is to compare and test the model’s performance on multiple volume of data, before finalizing the data-set. For Eg: If your model performs same on 1 yr and 2 yrs data, then 1 yr data should be sufficient for training the model.
- Sampling frequency should be selected so that all small process variability and uncertainties are captured and conveyed to your model appropriately. Eg: For less fluctuating operations sampling frequency of 5min, or even 1 hr should be competent, but with proper data validation of the same. On the other hand, process with large and rapid fluctuations in the parameters one might require data to be sampled at every few seconds or minutes.
- Published in Blog
80-20 Principle – A Key Metric to apply in Manufacturing Data Analytics

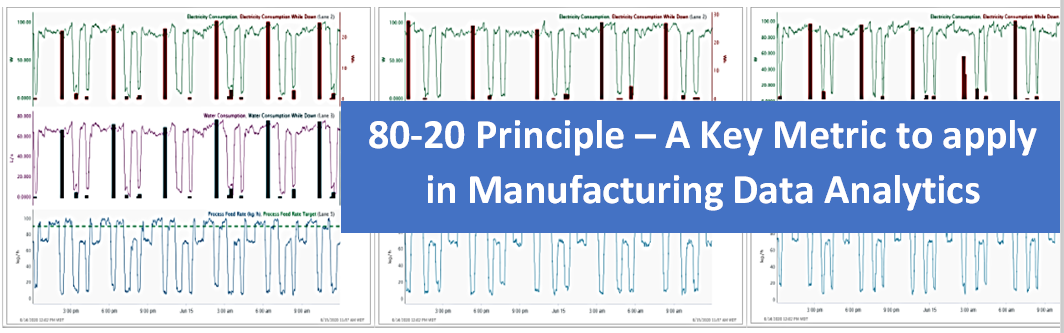
You can’t avoid it now! – The opportunity landscape of Data Analytics is increasing day-by-day in every industry. Many organizations have done huge investments in building and aggregating a data layer, whether it is in MES, Historian or a data lake. The value of data is being unlocked and leveraged for getting better insights. The innovative organizations are exploring the complexity of the problems (for e.g. deterministic statistics to Predictive/ Prescriptive Analytics) that can be solved using statistical/ML/AI methods. The value of analytics / ROI ranges from few hundred thousand dollars to millions of dollars. In a nut shell, you can’t avoid this now, to remain competitive; it will be inevitable for every organization to look into it in near future if not today!
A Challenge – Embracing data analytics in the process manufacturing industry and that too time-series data is still an uphill task. There are a lot of misconceptions when it comes to Process data type, ingestion / cleansing layer, handling time-series data, application of ML methods and finally analytics deployment. It all boils down to the efforts, data infrastructure investments, selection of right methods /approaches and analytics tools. It is not about solving one problem at a time and once in for all; it is a combination of questions that needs to be addressed, and most of the time it is subjective to the problem / use-case at hand.
You need to have a proper metric /evaluation criteria / framework to handle all these issues; as the success of analytics (end objective) depends on multiple factors. The 80-20 principle is such a metric that can be applied at every stage of data science and analytics projects – right from data source evaluation to cleansing techniques, IT infrastructure / tool selection, modeling methods to deployment.
What is 80-20 and how can it be applied to Data Science and Analytics projects?
80-20 rule is a metric to be applied in analyzing the efforts / investment /approach / weightage during different stages of a Data Science / Analytics implementation projects. It could be as simple as asking the 80-20 questions and taking right approach/decisions. It can be broadly classified in four main categories:
- Data Infrastructure
- Analytics Needs
- Analytics Environment
- Scale-up Strategy
Each of the above categories will have multiple activities and 80-20 principle can be applied for each of the activity. Let us take few examples from each category and see how it works-
Data infrastructure:
Data Source – Which data source to select for data analytics – DCS/ SCADA / Historian? Often times companies believe that the Scada/ DCS systems can be used to perform data analytics and ignore the challenges with the data set and its limitations for analytics. For e.g. following questions need to be asked:
- 80-20 (% of use cases): In how much % of use cases, raw data (DCS/SCADA) is appropriate vs. Structured data (Historian) needs?
- 80-20(% efforts): How much % of efforts will go in handling unstructured/ SQL data base to make it analytics-ready vs. having Historian in place?
- 80-20 (% time spent): How much % of time the process engineers / data scientists will spend in cleaning the unstructured data vs. representing the process / system for performing the analytics. For e.g. cleaning involves structuring, representing process Info., Time series evolution, Sampling Frequency, etc.
The best practice say that data analytics should be done on structured data aggregated through process historians for best results.
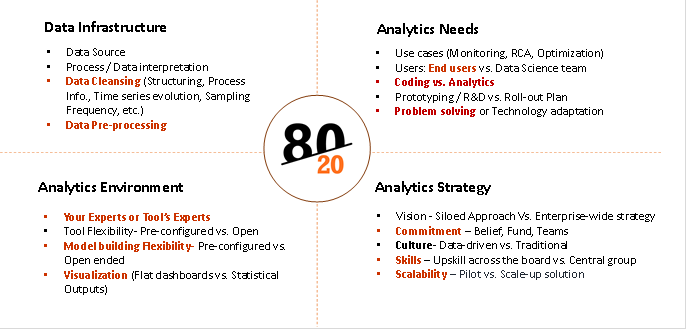
Figure 1: 80-20 Categories
Analytics Needs and Solution required:
In order to take a decision on selection of right analytics environment / technology / tools, you need to ask following questions:
What percentage of your analytics end objective fall into the following categories?
- 80-20 (% of use cases): Monitoring the current state of the system – Process Monitoring
- 80-20 (% of use cases): Learning from the past and deriving Process Understanding, identifying critical process parameters through RCA, its limits and monitoring the same. Do you have enough volume of data?
- 80-20 (% of use cases): Monitoring the future state of the system – Predictive/Prescriptive analytics. How much % of time will go in coding vs. analytics. Which ML models are prominent for the use cases you are handling, etc.
The answers to the above questions are required to select the right analytics environment/ solution, for e.g. – Data Historian connectivity, Statistics & ML Modeling capabilities, advanced visualization, ease of use by process enggs, etc. The use cases should be performed before finalizing the tools. Otherwise companies end up taking technology heavy solutions without these capabilities, which don’t address the real needs of data analytics.
Analytics Solution Evaluation:
You need to have analytics solution appropriate for your use cases. One of the Industry leading Process data analytics solutions Seeq (www.seeq.com) gives a good evaluation matrix to analyze the analytics needs as follows:
- 80-20 (which data): Can it handle time-series data and solve intricate process manufacturing problems? – Key features required to play with time-series data for better process understanding and data pre-processing
- 80-20 (% of experts time): Does the analytics solution rely on your experts or its experts? – End users (Process/ Operations Enggs. Vs. Centralized Data Scientist / expert team
- 80-20 (% of use cases solved): Is the analytics vendor more focused on the problems being solved or the technologies involved? – Is it solving problem or it is technologically overloaded and complex to solve problems
- 80-20 (Data handling time): Does the analytics solution require you to move, duplicate, or transform your data? – Time spent on data handling
- 80-20 (ease of use): Can the solution help your engineers work as fast as they can think? – Time spent on Coding vs. Analytics
Analytics Scale-up / Roll-out Strategy:
It is observed that the data analytics initiative always starts with a small group, which evaluates the potential, prototype analytics, and try to scale it up. There are many important factors that play a significant role in scaling data analytics across the board. You need to analyze the percentage weightage of these factors to devise a scalable strategy. You can apply 80-20 principle here as well as follows:
- 80-20 (level of Commitment)à Is data science and analytics a siloed initiative by a smaller group or it has a buy-in from executive management? It calls for a commitment, investments, long-term strategy and a strong belief in taking the organization on ‘Analytics Transformation’ journey. You need to put a metric – 80% buy-in vs. 20% buy-in and chart out a plant to prove to management the ROI on analytics
- 80-20 (Analytics Maturity %)à How much percentage of ‘Analytics Maturity’ your organization has >80% or <80%. The maturity depends on multiple factors such as readiness on analytics ready data infrastructure, Skills and culture (central vs. various groups), incentives for change, methods, approach, tools required, etc.
- 80-20 (Roadmap)à What is your roll-out plan? What % of groups are going to implement analytics solution. The scale-up strategy across the similar assets / processes / plants, etc.

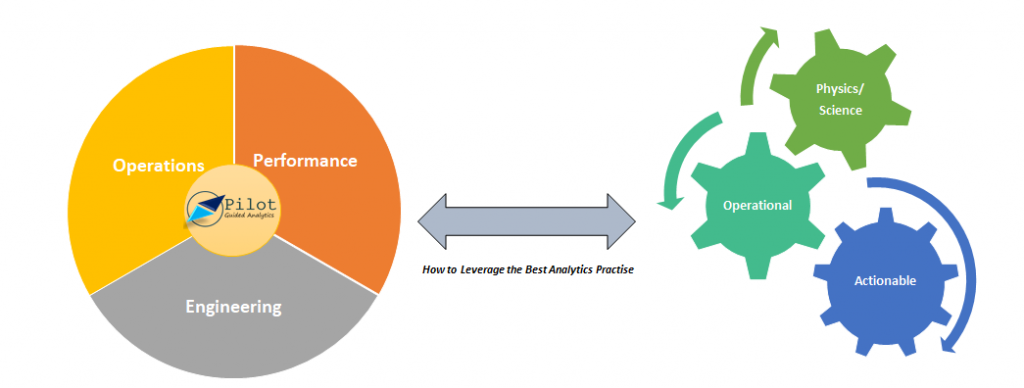
Tridiagonal Solutions through its Pilot Guided Analytics Services framework apply such 80-20 principles and assists companies in their data analytics journey.
‘Pilot-Guided Analytics’ is a framework for initiating, scaling and implementing Data Science and Analytics Solutions across the organization. It is a methodical way of implementing data transformation and KPI-based data analytics strategies.
- Published in Blog
Need for Cleaned Data At Place (CDP) for performing efficient Process Data Analytics — Data Cleaning

In this article our focus will be primarily around cleaning of the data, for efficient analytics. Data cleaning is one of the most important step in the overall framework of data analysis/science methodology. Efficient data cleansing could result to a more accurate applied analytics. But, there is a fine line between the conventional data cleaning methods and data cleaning for process-manufacturing data. By rules, data cleaning gives to us a very simple and intuitive procedure to follow, if there is any missing, invalid, outlier,. etc values. You can remove that sample point, remove that entire feature if required, fill with some logical values and many more. Although, this brings to you the ease of applying the analytics, but does that solve your problem and concerns with the data integrity in process-manufacturing? The answer is no!!
Let’s start with data integrity, and it’s importance. The root of this term can lead you to various attributes and terminologies such as
- Accuracy,
- Completeness
- Consistency of the data throughout it’s entire time-cycle
Accuracy
Accuracy will point to the sensor’s correctness of the values, and the latency in collecting the signal’s value. It also help us in determining whether the values that is being stored is an outlier or not, and what corrective actions needs be deployed in order to make this step efficient. The estimated error between the actual value and the recorded value can also help you in devising a better control strategy depending upon the deviation between the set point and the recorded value. On the other hand, the latency in recording the sensor data will dictate and enable the operations team to sense the fault and take early actions to respond of the process in a desired way.
To enable predictive analytics for process improvement, both correctness and the latency plays a vital role. The developed model at the production scale confides heavily on the underlying data layer, which gives a sense about the importance of quality of the data being considered. Automating the data cleansing procedure will boost the process operations in mitigating the inappropriate dynamics of it, and create a metric for an enhanced control actions. One good example of this could be developing a golden batch profile around the critical signals of the process. This method will assume that the signal that’s been considered is highly accurate and is pulled to the display with very less delay in time, which will help the operator to take the necessary action on the near-real time without much loss in the overall economy of the process effectiveness. Another example of this could be a model predictive control, where the developed model depends and learns to take the actions, based on it past actions or, the data that it was exposed to. This reinforces the whole concept and demands for reconsideration of the entire underlying infrastructure that can increase the preciseness of the data captured.
Following are the possible use cases that could be applied if the data accuracy is considered to be precise:
1.Golden Batch profile for real time monitoring,
2.Dynamic modeling and optimization,
3.Continuous process verification,
4.Overall equipment effectiveness and reliability engineering
5.Equipment failure and performance prediction
Completeness
The term “Completeness” points to a very common issue of missing data or invalid data. The other-side interpretation of this could be to realize whether the data being considered is sufficient enough for understanding the process or not. To be honest, the conventional data wrangling and cleaning techniques is not a good practice to be undertaken while dealing with the process data. The domain knowledge or the SMEs know-how should actually be taken into consideration for playing around with the data. For example, removing a process feature(process parameter) should be logical, and it should not be a cause of some major process information loss. The missing cells in some particular feature cannot be always replaced with the average (or any similar logic) of the data-set, it must follow the protocol of time-series evolution of the process and should be a practical representation of the operations strategy. One key understanding which is easy to miss is the knowledge of the first principle models. You can never override the physics and the understanding behind the process.
It’s been observed many times that there are some process parameters in the data table which shows very less variance around it’s mean value, which pronounces the user to remove that feature without even considering the repercussions of it, where we(domain experts) know by first principle model that the removed feature is important. Instead, the first principle model should be considered to make a note on the process parameters that should be considered for modeling, in-order to capture the physics behind the operations accurately.
Consistency
The term “Consistency” itself suggests that uniformity of the data is also one of the key important attribute to be considered while cleaning the data. Inconsistency in the data-set could be an outcome of multiple possibilities such as time-varying fluctuations, variability, or noise. This could also arise if the data-set contains startup-steady-shutdown operations at one place, which sometimes is hard to model as most of the first principle models assume steady operations as the standard. Which point to the fact that if your data-set represents the overall transient and steady state operations then the model would require frequent tuning, optimization and management in the real-time. It’s intuitive that model management during transient operations would be more cumbersome than steady state one. Even the methods, approach, and solutions that underlies in the background of process analytics is different for both transient and steady state operations. Some of the opportunities in this domain could be,
- Minimizing the time of the transient operations,
- Smooth transition between these two operation strategy,
- Optimizing the process parameters,
- Grade transition for multi-grade products
Conclusion
It’s well observed that cleaning the data is not so straight-forward, as it will require the domain expertise, process evolution knowledge, process oriented logical filling and replacing of the values. Even dropping of a feature is determined by the first principle model. Even a feature attributed with low variance could be as important as others. The behavior of trends in data-set could be very different for transient and steady-state operations.
Which lets us to conclude that cleaning of the data is itself dependent on the process you are dealing with, nature and behavior of the same, and many more adhoc process attributes which needs to determined and considered at times. Cleaning the data might be a recursive step if the data-set does not seem to be a good representation of the process.
If you have missed out the previous article in this series which was about Data aggregation, then please visit this link which should guide us to reinforce some of the strong conceptual understanding behind data pre-processing in process-manufacturing.
I Hope this was helpful, and should bring to you some strong insights about the process understanding when using the data-driven approach to drive a solution.
Written by:
Parth Sinha
Sr. Data Scientist at Tridiagonal Solutions
- Published in Blog
Root Cause Analysis using python for Process/Manufacturing Industry

Good morning, good afternoon or good evening to you, for wherever you’are and at what time you read this article.
In this article I will try to cover the Root Cause analysis(RCA) for almost any kind of processes or equipment that falls under the process or manufacturing industry using a methodical way of analysis. Briefly speaking, the kind of analytics that is widely considered in process industry falls under the following categories, as below,
- Monitoring or Prognostic,
- Descriptive,
- Prescriptive,
- Diagnostics,
- Predictive
In-order to stick to the topic of discussion we will restrict ourselves to the diagnostic kind of analytics, where you get to see the space for RCA. This kind of analytics is mostly considering or is mostly the function of the volume of historical data that you have collected, it’s sampling frequency rate, the amount of variability or the interactions that should be necessary and sufficient enough to estimate the state of your system. Here, the former point speaks about the volume of data, which is pretty much subjective to the analytical case-study that you’re trying to cover. (For some use cases 1 year data is sufficient, and for some even 3–5 yrs data is scant)
I hope this gives you a brief idea about the difficulties involved in process historical data aggregation and other process data engineering phases.
Here, we will showcase on how to use Principal Components Analysis (PCA) for performing RCA. PCA is a unsupervised machine learning algorithm, that assumes the linear correlation among your feature matrix, and transforms them to a reduced dimensional space.
Note: Since PCA does not considers the labelled values for analysis(Transformation and dimension reduction), it would not be a good practice to use this model directly for prediction without having the check on the correlation of your transformed, reduced input features and your labelled features. It is possible that PCA could have eliminated some important input features that shows high correlation with your labelled outputs.
Following would be a guided roadmap to perform RCA using PCA:
Please note that in this article we will cover only the application of the models for RCA and not on what’s and why’s behind the algorithm.
- Gather the dataset that you want to include for analysis (This article assumes that data engineering and cleaning is done),
- Apply PCA on the dataset using the pre-cooked PCA model available in scikit learn package in python,

3. Get the information about the captured variance, feature importance or eigen values corresponding to the principal components.
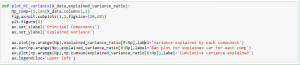
The output of the above code should be like,
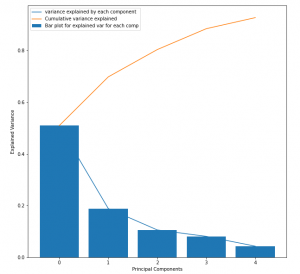
This should be helpful for estimating the number of principal components to consider for RCA over the process dataset. This plot is also known as the scree plot, where the blue curve could be imagined as an elbow, and the joint(point on the curve where maximum slope change occurs) represents the number of principal components to consider.
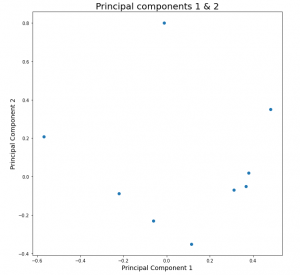
4. Plot the top 2 principal components, in-order to get the estimation of the correlation between the transformed features. This will be important because PCA performs the orthogonal transformation of the features by capturing maximum variability of the input space, which speaks a lot about the state of the system. The points in the plot represents the dependency or relationship of the input features with the PC1 & PC2 respectively. This will give you the quantified idea about which principal component captures the variability of which all input features and how much. This will be very important step for evaluating the performance of the model. At this stage the user should leverage the flexibility of the PCA and identify whether your model is able to capture the linear variabilities or not,
This enables the user to make decision with 3 degrees of freedom, as follows,
- If sufficient variability is captured by Principal components 1 & 2, then continue
- If the amount of variability captured is not sufficient then increase the number of principal component to capture the sufficient information about the process,
- If both of the above steps fail, then it is the indication that linear representation of your dataset is not a good option as it performs very poorly. Go back to the model selection step and choose a non-linear model for better performance, which means to say, drop PCA.

4. Congrats!!! if you are on this step, then it means that PCA has a performed well for your dataset. Let’s leap a step further, where we will be addressing and identifying the abnormalities, anomalies and outliers in the process.
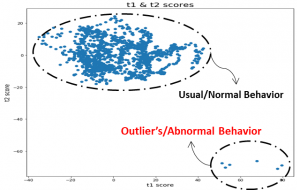
T-score plot
Score plots using PCA can very well address the issue of unusual behavior in the process or system that could result in failure of operations, equipment, deviation from the ideal quality of products in the output. Below is the snap of the t-score plot,
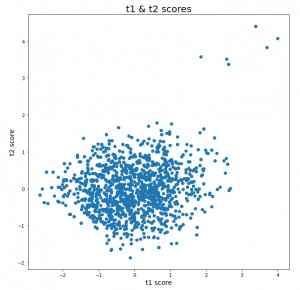
Score plot is calculated by taking the element-wise multiplication of your X(input feature space) dataset and the transpose of your principal components matrix.
t-score-matrix= X * (PC-matrix).transpose
The interpretation from this plot are as follows,
- The cloud or cluster of points represents the usual or normal behavior, where the points lies very close to each other. Whereas the points for which the mahalanobis distance is significantly more than the others, speaks about the abnormality in the behavior.
- In the above figure, it’s conspicuous that 6 points in the top right are lying at a significant far distance from the others. This could be a sign of the abnormality, which could be an outcome of deviations introduced in the process parameters or the material properties itself.
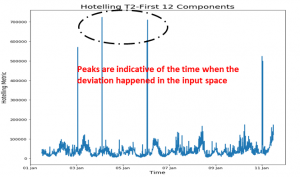
Hotelling’s T2 plot
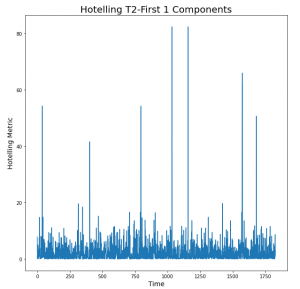
Hotelling’s is the extension of the student t-test. This metric is calculated as follows,
T2=t-score-matrix[:,i]/explained-variance-ratio[i], for ith transformed feature.
If we have considered the 2 principal components, then the above metric will be evaluated corresponding to those 2 components(i={1,2}) and then the resulting vectors will be added to get the final metric array which will contain it’s element in the order of time.
The peaks seen in the plot are the indication of the time, at which the un-clustered points observed in the t-score plot occurred. Here, the height of the peaks says about the intensity of the deviations, which makes it a requirement to focus first at the point in time where the highest peak was observed and so on. Also, the investigation process for the largest peak should be easier than the rest because it shows a larger deviation, to which one would expect that the deviations in the operational parameters or process parameters could be easily identified.
Conclusion and take-away
The key idea to take from here is to visually look into the trends of those process parameters that are highly correlated with the Principal components 1 & 2. If deviations or unusual behavior than normal is seen the trends, then that should be the indication to understand why this happened, or in simple words, what made the process to be operated at that unusual conditions. And if, the process parameters looks fine at the first place, then this investigation for RCA is pointing at material properties, which is the function of the vendor, quality of raw material, age of the raw material and so on.
ways to perform RCA:
- Looks into the t-score plot if there are any outlier points (points lying away from the cluster), if yes then follow the second step, and if no then it concludes that the data-driven approach was not able to capture those unwanted behavior that happened in reality
- Hotelling’s metric can give you the idea about the time point at which those deviation or unusual behavior was observed by looking into the peaks.
This makes the task pretty much easier to diagnose the process, with the help of captured understanding of the Analytics and domain.
The main drawback of this could be that Data scientists or the analysts who are involved in this task also requires the understanding of the domain, which can make his/her task easier to understand the process data.
I hope that this approach will prove to be a powerful key to a many process/manufacturing industries who are looking for process improvement by performing the historical data analysis. Understanding the behavior of the process in this way will give then the flexibility and wisdom to enable themselves to look for a better way of operations and a better insights about the process itself.
Volume of data could be a challenge for many industry but nonetheless if taken this approach, then it should empower them with a quick crude insights about historical behavior of the process. As a recommendation, one could start even with a small volume of data (1 or 2 months), and see how this model or approach works, as the required volume of data is purely a function of the process. A first level of investigation with the initial volume of dataset should give you the idea about how much the ML/AI model is able to understand your process. And in reflection, if the model doesn’t capture much of your process variability or information in the principal components, then you should try to gather more data until the saturation is observed in the information stored by the model.
Let me know your thoughts on this approach, if this idea helps you to improve the performance of your process.
Thanks for spending time in reading this article.
Written by:
Parth Sinha
Sr. Data Scientist at Tridiagonal Solutions
- Published in Blog
Need for Cleaned Data At Place (CDP) for performing efficient Process Data Analytics – Data Aggregation

In this article we will look into the importance of all attributes related to data for smart manufacturing and digital twin. We will also cover the importance of industrial maturity with respect to the IT infrastructure, and various initiatives that have been a major driving force for upgrading and up-skilling of the technology.
This series will cover the following:-
- Data Aggregation,
- Data Cleaning,
- Volume of datasets,
- Real time Analytics,
- Deploying your ML/AI solution to provide a industry-wide solution for ROI benefits
In this article we will focus on the first point which is “Data Aggregation”, and in the subsequent write-up will take the other topics each one by one.
The whole intent of this series is to establish a robust understanding of the pros and cons of Data Analytics and it’s implementation from a business model perspective. Which are those critical steps that carry the maximum potential to enable your organization with a huge business outcomes and time-savings.
Data Aggregation
Why?
Industry 4.0 has recently seen a major attraction in almost all the process-manufacturing sectors. A major digital initiatives drive has been ventured by many giant Oil&Gas, Pharma, Heavy metals and many other industries. Precisely, a clear need for most of these digital initiatives is either the lack of complete understanding of the process or the ROI value from the research programs they run for smart manufacturing. This requires an extensive programs to be initiated either for running a series of expensive experiments, or a very computationally expensive mechanistic simulations by solving the mechanistic models of the related process. A classic example for this could be like, setting up of a modeling environment for understanding the crystallization process or experimental runs for understanding the corrosion, erosion phenomenon. These initiatives suffer from two crucial drawbacks, which are, ending up with unsuccessful outcomes, or no major benefits in the investments, as it was meant mostly just for understanding and gaining the insights about the process and its parameters, and not directly for improving the process at the first place. This paves the way for replacing your existing techniques by various data-driven business models, as most of the limitations in the above mentioned initiatives gets eliminated here. It reduces the dependencies on layers such as mathematical models, experimental runs, expensive simulations, and brings the focus on “Data”, which is our new star.
Well, this does not mean that, now there will be no requirement of process understanding, but yes, it will definitely reduce the efforts and investments that went on capturing the insights using the utilities discussed above. But again, a big challenge that comes up at this stage is “Data” itself,
- Is your process data being captured on real-time basis?
- Do you store the historical data? Either in Process Historians or any similar database?
- Which all signals should be stored for better insight?
tagging, indexing, architecture,…, etc
How?
An important thing to understand here is that the basic underlying principle of any data-driven model is that “Your Data is the sole entity that speaks about your process performance”. Which means that anything that’s directly associated with data is important to us. Some of the factors could be the volume of the data, cleanliness of the data,..etc. A major gap we typically see today is that, most of the Industries have still not upgraded their internal infrastructure for data collection. They still operate on SCADA/DCS units, and not the Process Historians, which breaks the nexus of Process and digitization. The former is meant for the supervisory control as the name suggests by itself, and not for performing the analytics, whereas the later considers all the necessary requirements that can add value to your analytics. To name a few pros of Historians over SCADA are:-
- Can capture large volume of data (over 10–20 yrs),
- Handles basic data cleaning,
- Handles tagging and indexing of the signals,
- Can structure the data based on the assets,
- Allows the user to have basic visualization of the historical trends
Although, this does not unveil all the stages(advantages and disadvantages) behind the curtain of Advanced Analytics, but yes, it enables and opens-up the gateway for you to perform it. Here, the limitation on the basic entity of data-driven approach is observed to get eliminated.
Now?
So far so good. Now, since your industry is able to capture and store the data in process historians, you should be good to get along with many digitization initiatives and approaches. The most suggested and logical way to go from here would be to define a use-case and tone down your focus on only those signals that are associated with it. This should bring clarity in many sense in defining the methods, Approach, and solution for your Business.
Our Process Analytics Group(PAG) from Tridiagonal Solutions could help you in establishing a successful and a wide range of solutions that could be leveraged in many of these digitization journey, right from data collection to advanced modeling and roll-out plan for deployment.
In the next article in this series we will discuss about importance of data cleaning and it’s impact on the solution. Stay tuned!!
I hope this article was helpful to you for establishing your approaches in digitization journey.
Written by:
Parth Sinha
Sr. Data Scientist at Tridiagonal Solutions
- Published in Blog
- 1
- 2