With this article we will try to establish our understanding around when, why and how monitoring the assets can solve the business problem. Monitoring the assets or prognostics analytics seems to be very widely used technique, which has been accepted across many Oil and Gas industry. When we say “Monitoring”, a direct implication could be – Monitoring the process parameters or the important KPIs for the Assets.
But wait a second, if we do not have the KPI readily available from a sensor then? How can we derive a metric that can aptly be utilized for making our analytics possible in real-time. Are there any techniques available?
One big challenge that pops-up when we are trying to solve the process related asset is that no single parameter dictate the behavior of the entire process, instead it’s the combination of multiple parameters. This arises due to the fact that there are multiple unit processes going on in the equipment, which attributes to large variability in the system. So a key insight from such process is that, there lies a significant possibility of having a multiple operating conditions(combination of them) where your process may diverge or converge.
So how can we address such challenges?

Lets take a step by step approach to understand this.
When Monitoring
Monitoring becomes a prominent approach when we are looking into the real-time variability analysis, but what signal to monitor, comes either from SMEs or through applying advanced ML/AI models. Advanced ML (supervised or unsupervised) helps us to identify the important KPIs depending upon the behavior of the data. The signals that these model predict are also known as ‘Soft-Sensors’, which is derived using the unified approach of data-driven techniques and science. One observation with the Assets, which are “industry enabler’s” is that they have established itself to the point where we know the KPIs with a strong conviction. Which means that, monitoring these specific parameters will be sufficient enough to estimate its performance. But there are assets for which the performance is heavily governed using the process reactions, mass transfer, heat transfer..etc, which makes it difficult to identify the KPIs that would dictate the process. In such cases monitoring wouldn’t help if you are bereft of the critical parameters.
This makes sense right? As monitoring will only help if you know what to monitor!!
So, for process oriented assets we still have more to explore to establish the right metric for identifying the KPIs. By making use of the soft-sensors modeling techniques one can create the KPIs that we can monitor in the real-time. For more information on how to make the best use of soft-sensor please have a look into my earlier blog on soft -sensors.(See below)
Why Monitoring
Monitoring always helps you to maintain your process deviations and abnormalities in control, if you know what to monitor. In recent advances it has seen a huge potential – Increasing your ROI just by monitoring your assets. But as discussed monitoring is more reliable where the undergoing process is fairly simple and we know what signal to monitor to improve your process performance. This kind of analytics is heavily used for assets such as pumps, compressors, heat exchangers, fans, blowers..etc. And since predicting the failure of such assets beforehand can surmount the production losses and inefficiencies in the downstream processes.
Similar kind of philosophy goes behind the processes with the only challenge being that you should know how to derive those KPIs (Which is to be monitored). Today, industry rely heavily on lab analysis for quality check in the product stream, or depends totally on equipment such as gas chromatography..etc to check the efficiency of the separation (Just an example). But due to the advancements in the technology and computational capacity, we can work on those historical data from lab (quality data) and create a workaround for modeling the soft-sensors (Derived KPIs-Refer my previous article on soft-sensors). These soft-sensors enable the engineers to detach their dependencies from the lab analysis and monitoring equipment.
In short, the mathematical model looks for its suitable and applicable place to help the operator by letting him get rid of the old techniques. Moreover, this way your dependencies on the first principle models also gets reduced to some extent, otherwise this was the only source of reliability earlier. More justice to such new techniques could be done if the data collected is sufficient enough, with not much expense on the data integrity. (See below)
How Monitoring
How monitoring can solve your business challenges? Good question, isn’t?
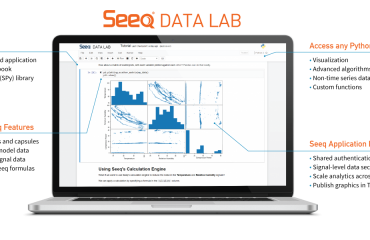
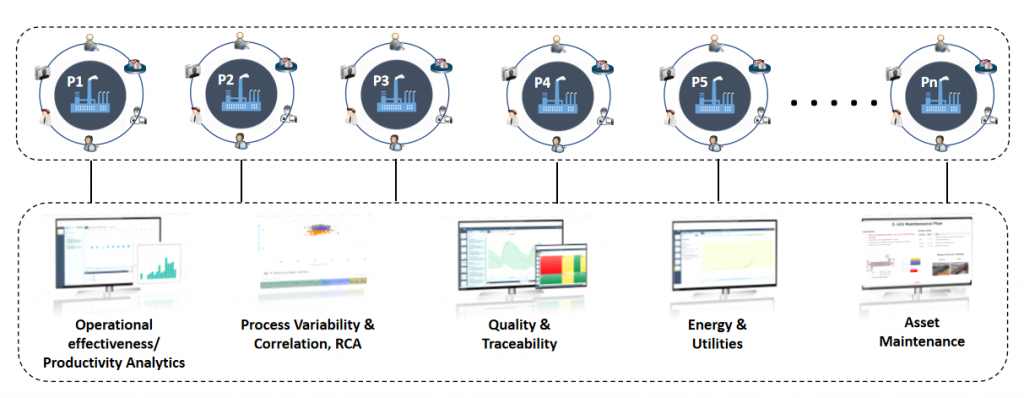
So let’s understand first how the outcome of a data analytics use case is consumed in the industry. The operator/engineer looks for a solution which is comprehensive to him and speaks the process language, which is compilation of the entire analytics in a single screen. This is also known as a dashboard, a dynamic dashboard more precisely. There are tools and platforms available that can easily load your indicators and update it in real-time. This solution also keeps the actual environment of the analytics/code separated from the operators so that they can focus more on the consumption part, rather than focusing on how this analytics was created. (One such known solution is Seeq, which can take care of performing the analytics and then publishing the content in a dynamic dashboard for operators)
Explained with a use case: Distillation column
In this case our objective was to predict the column vapor pressure and the important KPIs, which is mostly done through lab analysis today. Before we move ahead, let us see the list of tags that were collected:
1. Temperatures for Distillation Column and Re-boiler (Real time Process Condition)
2. Pressure (Real time Process Condition)
3. Flow rates (Real time Process Condition)
4. Vapor Pressure (Lab analysis)
3 years worth of data was collected with a sampling rate of 5 mins.
Note: Data sanity check was performed before applying the model for creating the soft-sensor.
For the interest of this article our focus will only be the soft-sensor which we will be monitoring in the real time to observe the performance. Please note that the KPIs which were identified should also be monitored to keep the deviations in the operations under limit to improve the controller actions. But since the direct parameter to monitor the quality is the soft sensor, so we will keep it in the lime light.
Steps:
1. The vapor pressure data was regressed against the process parameters using random Forest model
2. GridsearchCV was used to tune the hyper-parameters for achieving the maximum accuracy
3. The model was trained on 2.5 years of dataset and the rest was used for testing purpose
4. The reliability of the trained model was check for its consistency on the multiple shuffled dataset. The
standard deviations in the model metric was checked to evaluate the robustness of the model and it’s predictive
power
5. And finally the predicted signal or the soft-sensor was used on the production data for real time predictions

I really hope that this article helped you to benchmark your strategy for deriving the right analytical strategy in your Industrial Digitization journey. For this article our focus was on monitoring the right KPIs – soft-sensors for your process driven Assets, and stay tuned for more interesting topics.
Who We Are?
We, Process Analytics Group(PAG), a part of Tridiagonal Solutions have the capability to understand your process and create a python based template that can integrate with multiple Analytical platform. These templates can be used as a ready-made and a low code solution with the intelligence of the process-integrity model (Thermodynamic/first principle model) that can be extended to any analytical solution with available python integration, or we can provide you an offline solution with our in-house developed tool (SoftAnalytics) for soft-sensor modeling and root cause analysis using advanced ML/AI techniques. We provide the following solutions:
- We run a POV/POC program – For justifying the right analytical approach and evaluating the use cases that can directly benefit your ROI.
- A training session for upskilling the process engineer – How to apply analytics at it’s best without getting into the maths behind it (How to apply the right analytics to solve the process/operational challenges)
- Python based solution- Low code, templates for RCA, Soft-sensors, fingerprinting the KPIs, and many others.
- We provide a team that can be a part of your COE, that can continuously help you to improve your process efficiency and monitor your operations on regular basis.
- A core data-science team (Chemical Engg.) that can handle the complex unit processes/operations by providing you the best analytical solution for your processes.
Written by,
ParthPrasoon Sinha
Sr. Data Scientist
Tridiagonal Solutions
