80-20 Principle – A Key Metric to apply in Manufacturing Data Analytics

You can’t avoid it now! – The opportunity landscape of Data Analytics is increasing day-by-day in every industry. Many organizations have done huge investments in building and aggregating a data layer, whether it is in MES, Historian or a data lake. The value of data is being unlocked and leveraged for getting better insights. The innovative organizations are exploring the complexity of the problems (for e.g. deterministic statistics to Predictive/ Prescriptive Analytics) that can be solved using statistical/ML/AI methods. The value of analytics / ROI ranges from few hundred thousand dollars to millions of dollars. In a nut shell, you can’t avoid this now, to remain competitive; it will be inevitable for every organization to look into it in near future if not today!
A Challenge – Embracing data analytics in the process manufacturing industry and that too time-series data is still an uphill task. There are a lot of misconceptions when it comes to Process data type, ingestion / cleansing layer, handling time-series data, application of ML methods and finally analytics deployment. It all boils down to the efforts, data infrastructure investments, selection of right methods /approaches and analytics tools. It is not about solving one problem at a time and once in for all; it is a combination of questions that needs to be addressed, and most of the time it is subjective to the problem / use-case at hand.
You need to have a proper metric /evaluation criteria / framework to handle all these issues; as the success of analytics (end objective) depends on multiple factors. The 80-20 principle is such a metric that can be applied at every stage of data science and analytics projects – right from data source evaluation to cleansing techniques, IT infrastructure / tool selection, modeling methods to deployment.
What is 80-20 and how can it be applied to Data Science and Analytics projects?
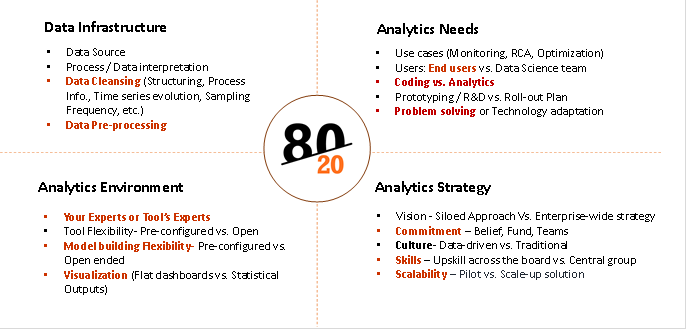
80-20 rule is a metric to be applied in analyzing the efforts / investment /approach / weightage during different stages of a Data Science / Analytics implementation projects. It could be as simple as asking the 80-20 questions and taking right approach/decisions. It can be broadly classified in four main categories:
- Data Infrastructure
- Analytics Needs
- Analytics Environment
- Scale-up Strategy
Each of the above categories will have multiple activities and 80-20 principle can be applied for each of the activity. Let us take few examples from each category and see how it works-
Data infrastructure:
Data Source – Which data source to select for data analytics – DCS/ SCADA / Historian? Often times companies believe that the Scada/ DCS systems can be used to perform data analytics and ignore the challenges with the data set and its limitations for analytics. For e.g. following questions need to be asked:
- 80-20 (% of use cases): In how much % of use cases, raw data (DCS/SCADA) is appropriate vs. Structured data (Historian) needs?
- 80-20(% efforts): How much % of efforts will go in handling unstructured/ SQL data base to make it analytics-ready vs. having Historian in place?
- 80-20 (% time spent): How much % of time the process engineers / data scientists will spend in cleaning the unstructured data vs. representing the process / system for performing the analytics. For e.g. cleaning involves structuring, representing process Info., Time series evolution, Sampling Frequency, etc.
The best practice say that data analytics should be done on structured data aggregated through process historians for best results.

Figure 1: 80-20 Categories
Analytics Needs and Solution required:
In order to take a decision on selection of right analytics environment / technology / tools, you need to ask following questions:
What percentage of your analytics end objective fall into the following categories?
- 80-20 (% of use cases): Monitoring the current state of the system – Process Monitoring
- 80-20 (% of use cases): Learning from the past and deriving Process Understanding, identifying critical process parameters through RCA, its limits and monitoring the same. Do you have enough volume of data?
- 80-20 (% of use cases): Monitoring the future state of the system – Predictive/Prescriptive analytics. How much % of time will go in coding vs. analytics. Which ML models are prominent for the use cases you are handling, etc.
The answers to the above questions are required to select the right analytics environment/ solution, for e.g. – Data Historian connectivity, Statistics & ML Modeling capabilities, advanced visualization, ease of use by process enggs, etc. The use cases should be performed before finalizing the tools. Otherwise companies end up taking technology heavy solutions without these capabilities, which don’t address the real needs of data analytics.
Analytics Solution Evaluation:
You need to have analytics solution appropriate for your use cases. One of the Industry leading Process data analytics solutions Seeq (www.seeq.com) gives a good evaluation matrix to analyze the analytics needs as follows:
- 80-20 (which data): Can it handle time-series data and solve intricate process manufacturing problems? – Key features required to play with time-series data for better process understanding and data pre-processing
- 80-20 (% of experts time): Does the analytics solution rely on your experts or its experts? – End users (Process/ Operations Enggs. Vs. Centralized Data Scientist / expert team
- 80-20 (% of use cases solved): Is the analytics vendor more focused on the problems being solved or the technologies involved? – Is it solving problem or it is technologically overloaded and complex to solve problems
- 80-20 (Data handling time): Does the analytics solution require you to move, duplicate, or transform your data? – Time spent on data handling
- 80-20 (ease of use): Can the solution help your engineers work as fast as they can think? – Time spent on Coding vs. Analytics
Analytics Scale-up / Roll-out Strategy:
It is observed that the data analytics initiative always starts with a small group, which evaluates the potential, prototype analytics, and try to scale it up. There are many important factors that play a significant role in scaling data analytics across the board. You need to analyze the percentage weightage of these factors to devise a scalable strategy. You can apply 80-20 principle here as well as follows:
- 80-20 (level of Commitment)à Is data science and analytics a siloed initiative by a smaller group or it has a buy-in from executive management? It calls for a commitment, investments, long-term strategy and a strong belief in taking the organization on ‘Analytics Transformation’ journey. You need to put a metric – 80% buy-in vs. 20% buy-in and chart out a plant to prove to management the ROI on analytics
- 80-20 (Analytics Maturity %)à How much percentage of ‘Analytics Maturity’ your organization has >80% or <80%. The maturity depends on multiple factors such as readiness on analytics ready data infrastructure, Skills and culture (central vs. various groups), incentives for change, methods, approach, tools required, etc.
- 80-20 (Roadmap)à What is your roll-out plan? What % of groups are going to implement analytics solution. The scale-up strategy across the similar assets / processes / plants, etc.

Tridiagonal Solutions through its Pilot Guided Analytics Services framework apply such 80-20 principles and assists companies in their data analytics journey.
‘Pilot-Guided Analytics’ is a framework for initiating, scaling and implementing Data Science and Analytics Solutions across the organization. It is a methodical way of implementing data transformation and KPI-based data analytics strategies.
- Published in Blog


