Virtual Sensor Modeling for Oil and Gas Rate
- Published in Oil & Gas
Devising your deployment strategy-ML Model
This article should help you to set a benchmark for how to decisively deploy ML/AI models considering your investments to be in the right software infrastructure/architecture/platform, guiding all through your journey of manufacturing analytics. Deployment of any model is a strong function of the data stream including its quality – Accuracy, completeness & consistency (Covered in earlier article) and volume, sampling rate and its ultimate end-objective that will decide on how the end user is going to consume the analytics output.

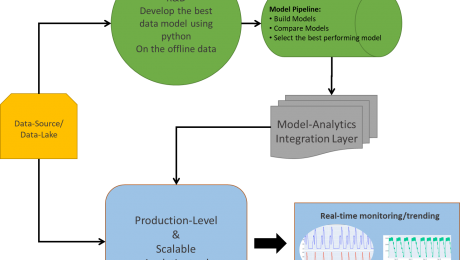
Fig: Deployment of ML/AI solution-Architecture
A major challenge for any deployment solution lies in its CAPEX and OPEX that goes behind developing the environment/infrastructure ready for analytics at site. This concludes not only with a huge investment in building data infrastructure (Eg-process historians/data-lake for big data storage, processing and analytics), but also keeping the one updated (Integrated) with the newest possible technology around the world for better performance.
Let’s get into a detailed understanding about various options and a few challenges in deploying the right analytics solution.
Deployment Options:
When it comes to the deployment of any analytics solution, we need to be selective about “how the end-user is going to consume its output?” or in simple sense harvesting your Analytics.

Fig: Kind of deployment (1)Real-Time, (2)Batch Data-wise
The answer to the above could be either visual analytics or predictive analytics using soft-sensor modelling, if feasible or by predicting on the batch of the dataset. Visual analytics can sometimes speak more about the uncertainties/abnormalities if the underlying dataset is a good representation of your operational strategy.
Real-time model deployment is not always feasible due to many of its limitations. Training-cross validating-testing the model is a time intensive and expensive task. At this point you may have a question in mind, “What if soft-sensors signal is created”? This is a pretty intuitive question (Assuming that most of the manufacturing analytics will involve regression model over classification tasks). So, in-order to set a context here, I will say, yes you are absolutely right!! One can create a soft-sensor signal to monitor the real operations, but only with a few limited models out there. Not all models will give you a regression line equation for building a soft-signal. For Eg: Random forest will enable you will the prediction, but being a tree predictor in its core, it won’t give you the regression coefficients for the parameters. And similar kind of behaviour is expected from many other ML/AI models. On the other hand, if you’re building a linear regression or polynomial model, it will give you the predictor’s parameters, which you can copy and build a corresponding soft-sensor for real-time calculations.
Many a times, it’s being observed that identifying the Critical Process Parameters and creating a statistical limit around it will give us a better outcome. For Eg: After applying a regression model you should be able to estimate the important parameters for prediction, upon which you can create a statistical limit of let’s say, ±1 or 2 σ for controlled operations (Assuming that the defined statistical limits are validated and tested on the real dataset).
One platform-scalable solution:
Selection of the right platform, which is scalable across all of the assets and processes, is required for efficient analytics in the production environment. To retain maximum fraction of the investments and benefits from your analytics a single solution/platform should be identified that provides you all the capabilities without much limitation. There are a few key capabilities that you should be looking for before selecting a platform,
- Easy and intuitive solution
- Should be able to handle most of the analytics requirements
- Should easily connect with multiple data-sources/data-lake at a single place
- Data connectivity to the real-time should be quick, without much delay
- Should be capable of performing data cleaning functionalities
- Capable of creating the soft-sensors/advanced mathematical operations
- Advanced visualizations
- Functionalities such as SPC/hidden pattern search/deviations should be packaged
- Should come with modelling capabilities, by enabling easy integration with python/R/Matlab programming languages.
- Provide a dashboard view (dynamic/static) for higher management, to enable them with easy decision making power.
- Above all, the analytics performed on one asset should be easily scalable across all the other assets.
R&D V/S Production Scale:
When it comes to the Production scale, the deployment of the analytics is limited by various elements such as, the databases, whether time-series or SQL, modelling capabilities, whether Python or R, the platform architecture, whether light environment or not. All of these functionalities should be considered in mind before deploying any architecture.
One key thing that we might miss out easily is that the platform should have the capability to provide the output in various formats, considering the end-user. It could be for operators, or for the engineers, M&ST team, operational intelligence team, or the higher management.
On the other hand, python being a fantastic modeling environment requires a lot of coding and modeling experience, which is not feasible for all the users. Although it’s pretty good choice for R&D level of analytics, where the user himself is expected to code-compute-create-model and consume the output of the offline data analytics. Also, modeling in python requires many other dependencies/packages which aids in fast coding, but at the expense of the processing power and speed. Its most suitable for the user who wants to try and check many new models out there in the market to compare its performance with the existing models.
Assuming a modeling project, to streamline the idea of scalability, one must starts with modeling in the python environment and then somehow transforming its outcome into the analytics platform by either creating the soft-sensors or estimating the important process parameters and layering the limits over it. One other approach could be to train and validate the model on the sufficient offline dataset, and then from time to time test the model on the newly generated dataset to check its predictive power and estimate the outcomes, and if required go back and tune the model parameters until you get a satisfactory result with maximum accuracy.
To conclude, python should be selected, only for the research oriented modeling projects and not for the production level (deployment) analytics. Moreover, many new and existing technologies are available that provides to us with an easy python/R/Matlab integration capabilities within themselves, such as Seeq-To which you can write down your python scripts in Seeq Datalabs (Similar to jupyter Notebook) and model on the choice of data that you are connected with.
- Published in Blog
Need for Cleaned Data At Place (CDP) for performing efficient Process Data Analytics — Volume of Data

In this article (3rd in series) our focus will be primarily on the necessary and sufficient volume of the data that will be required for efficient process/manufacturing analytics.
Few questions that should come to your mind before applying analytics:-
- Why volume of data is important to fulfil your analytics requirement?
- How to determine the required volume of data beforehand?
- What are the data attributes that link to your data volume requirements?
The answer to all such questions lies in the process/operation you are dealing with. By all means, the data should be a good representation of your process. It should speak for your process variability, process operations strategy, and everything that helps in understanding the process. Metadata, which is an excerpt of your data, should give you a salient insight about the process parameters and it’s operational/control limits. It should also give you sufficient information about the good/bad process, which ultimately dictates your product quality, be in terms of poor yield, rejected batches..etc. This information is very much important for developing the model in the later stage, where it needs to get trained on all the process scenarios that data can represent. For Eg: Your model will be capable of predicting the rejected batches, only if the data that was fed to it carried that information in itself.
Two Key important attributes for validating your data is:
- The amount of data(Identified using the start and the end duration of the data)
- Sampling frequency
The amount of data

The answer to this is dependent on the kind of analytics you are interested in, such as predictive, diagnostics, monitoring..etc.
Monitoring: This kind of analytics requires near-real data, which needs to be controlled. The statistical limit to the identified signal is assumed to be estimated beforehand, either using using SPC, or it should come from the SME know-how.
Diagnostics: This layer of analytics is function of the historical data (minimum volume) that can give you the estimation of process variability. Identifying the parameters that can associate significantly with your product quality or output parameters. Sensitivity analysis of input space on the output parameters needs to be checked to validate the critical process parameters. Typically, 2-3 yrs of data is required to perform this analytics in process industry.
Predictive: The model developed in this stage is trained on the dataset, which assumes that the provided datset gives all the underlying information about the process. This also means that dataset must be carrying the important information about the uncertainties and abnormalities that happened in the past for efficient prediction. An important thing to note here is that the model will be able to predict all the scenarios of the process, it has learned (trained) from past using the historical data. If some uncertainties were missed out during the training the model, then again re-validation of the data, re-training of the model, tuning the model will be required. More and more data will give you a robust model, with better predictability. A minimum threshold of data, after which the model performance doesn’t vary significantly, should give you the right estimated volume of data.
Sampling Frequency
This parameter plays a very important role in analytics. The correct sampling frequency should result in a dataset which represents your process operations accurately. Maybe, with a higher sampling rate you miss out some important process information which could be critical for the model to understand for making better predictions. Dynamic and rapid operations can require the data to be collected at higher frequency (every 1 sec or 1 min). The collected data should be stored with minimum latency to a high performance database, for it’s efficient use in the analytics later. The performance of the database could be estimated using it’s data compression, asset structuring capabilities. It’s preferred to use Time series database (process historians) over SQL database for scalable and optimized analytics.
Conclusion
Both volume of data and sampling frequency plays a vital role in process analytics:
- Right volume of data should give justice to your model. Recommended approach is to compare and test the model’s performance on multiple volume of data, before finalizing the data-set. For Eg: If your model performs same on 1 yr and 2 yrs data, then 1 yr data should be sufficient for training the model.
- Sampling frequency should be selected so that all small process variability and uncertainties are captured and conveyed to your model appropriately. Eg: For less fluctuating operations sampling frequency of 5min, or even 1 hr should be competent, but with proper data validation of the same. On the other hand, process with large and rapid fluctuations in the parameters one might require data to be sampled at every few seconds or minutes.
- Published in Blog
80-20 Principle – A Key Metric to apply in Manufacturing Data Analytics

You can’t avoid it now! – The opportunity landscape of Data Analytics is increasing day-by-day in every industry. Many organizations have done huge investments in building and aggregating a data layer, whether it is in MES, Historian or a data lake. The value of data is being unlocked and leveraged for getting better insights. The innovative organizations are exploring the complexity of the problems (for e.g. deterministic statistics to Predictive/ Prescriptive Analytics) that can be solved using statistical/ML/AI methods. The value of analytics / ROI ranges from few hundred thousand dollars to millions of dollars. In a nut shell, you can’t avoid this now, to remain competitive; it will be inevitable for every organization to look into it in near future if not today!
A Challenge – Embracing data analytics in the process manufacturing industry and that too time-series data is still an uphill task. There are a lot of misconceptions when it comes to Process data type, ingestion / cleansing layer, handling time-series data, application of ML methods and finally analytics deployment. It all boils down to the efforts, data infrastructure investments, selection of right methods /approaches and analytics tools. It is not about solving one problem at a time and once in for all; it is a combination of questions that needs to be addressed, and most of the time it is subjective to the problem / use-case at hand.
You need to have a proper metric /evaluation criteria / framework to handle all these issues; as the success of analytics (end objective) depends on multiple factors. The 80-20 principle is such a metric that can be applied at every stage of data science and analytics projects – right from data source evaluation to cleansing techniques, IT infrastructure / tool selection, modeling methods to deployment.
What is 80-20 and how can it be applied to Data Science and Analytics projects?
80-20 rule is a metric to be applied in analyzing the efforts / investment /approach / weightage during different stages of a Data Science / Analytics implementation projects. It could be as simple as asking the 80-20 questions and taking right approach/decisions. It can be broadly classified in four main categories:
- Data Infrastructure
- Analytics Needs
- Analytics Environment
- Scale-up Strategy
Each of the above categories will have multiple activities and 80-20 principle can be applied for each of the activity. Let us take few examples from each category and see how it works-
Data infrastructure:
Data Source – Which data source to select for data analytics – DCS/ SCADA / Historian? Often times companies believe that the Scada/ DCS systems can be used to perform data analytics and ignore the challenges with the data set and its limitations for analytics. For e.g. following questions need to be asked:
- 80-20 (% of use cases): In how much % of use cases, raw data (DCS/SCADA) is appropriate vs. Structured data (Historian) needs?
- 80-20(% efforts): How much % of efforts will go in handling unstructured/ SQL data base to make it analytics-ready vs. having Historian in place?
- 80-20 (% time spent): How much % of time the process engineers / data scientists will spend in cleaning the unstructured data vs. representing the process / system for performing the analytics. For e.g. cleaning involves structuring, representing process Info., Time series evolution, Sampling Frequency, etc.
The best practice say that data analytics should be done on structured data aggregated through process historians for best results.
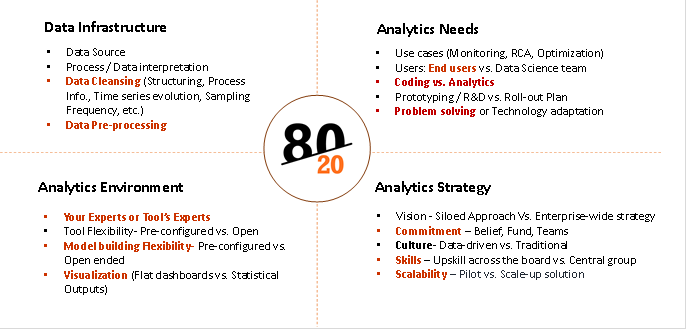
Figure 1: 80-20 Categories
Analytics Needs and Solution required:
In order to take a decision on selection of right analytics environment / technology / tools, you need to ask following questions:
What percentage of your analytics end objective fall into the following categories?
- 80-20 (% of use cases): Monitoring the current state of the system – Process Monitoring
- 80-20 (% of use cases): Learning from the past and deriving Process Understanding, identifying critical process parameters through RCA, its limits and monitoring the same. Do you have enough volume of data?
- 80-20 (% of use cases): Monitoring the future state of the system – Predictive/Prescriptive analytics. How much % of time will go in coding vs. analytics. Which ML models are prominent for the use cases you are handling, etc.
The answers to the above questions are required to select the right analytics environment/ solution, for e.g. – Data Historian connectivity, Statistics & ML Modeling capabilities, advanced visualization, ease of use by process enggs, etc. The use cases should be performed before finalizing the tools. Otherwise companies end up taking technology heavy solutions without these capabilities, which don’t address the real needs of data analytics.
Analytics Solution Evaluation:
You need to have analytics solution appropriate for your use cases. One of the Industry leading Process data analytics solutions Seeq (www.seeq.com) gives a good evaluation matrix to analyze the analytics needs as follows:
- 80-20 (which data): Can it handle time-series data and solve intricate process manufacturing problems? – Key features required to play with time-series data for better process understanding and data pre-processing
- 80-20 (% of experts time): Does the analytics solution rely on your experts or its experts? – End users (Process/ Operations Enggs. Vs. Centralized Data Scientist / expert team
- 80-20 (% of use cases solved): Is the analytics vendor more focused on the problems being solved or the technologies involved? – Is it solving problem or it is technologically overloaded and complex to solve problems
- 80-20 (Data handling time): Does the analytics solution require you to move, duplicate, or transform your data? – Time spent on data handling
- 80-20 (ease of use): Can the solution help your engineers work as fast as they can think? – Time spent on Coding vs. Analytics
Analytics Scale-up / Roll-out Strategy:
It is observed that the data analytics initiative always starts with a small group, which evaluates the potential, prototype analytics, and try to scale it up. There are many important factors that play a significant role in scaling data analytics across the board. You need to analyze the percentage weightage of these factors to devise a scalable strategy. You can apply 80-20 principle here as well as follows:
- 80-20 (level of Commitment)à Is data science and analytics a siloed initiative by a smaller group or it has a buy-in from executive management? It calls for a commitment, investments, long-term strategy and a strong belief in taking the organization on ‘Analytics Transformation’ journey. You need to put a metric – 80% buy-in vs. 20% buy-in and chart out a plant to prove to management the ROI on analytics
- 80-20 (Analytics Maturity %)à How much percentage of ‘Analytics Maturity’ your organization has >80% or <80%. The maturity depends on multiple factors such as readiness on analytics ready data infrastructure, Skills and culture (central vs. various groups), incentives for change, methods, approach, tools required, etc.
- 80-20 (Roadmap)à What is your roll-out plan? What % of groups are going to implement analytics solution. The scale-up strategy across the similar assets / processes / plants, etc.

Tridiagonal Solutions through its Pilot Guided Analytics Services framework apply such 80-20 principles and assists companies in their data analytics journey.
‘Pilot-Guided Analytics’ is a framework for initiating, scaling and implementing Data Science and Analytics Solutions across the organization. It is a methodical way of implementing data transformation and KPI-based data analytics strategies.
- Published in Blog
