Hail Machine Learning Models, but sometimes you’re Precarious!!
Good morning, good afternoon or evening to all. Pick the one which belongs to you!
So, before we get to the centerpiece of the article, just want to set some context. The focus of this article is not too technical, nor too generic, but this article is dedicated to all among us who in some way or the other is related to the field of digitalization in the manufacturing industry.
Sometimes we are too much taken by the technicality of the problems, that we stop thinking about it in a crude engineering way. Don’t you feel so?
Sometimes, it’s suitable (and a need too!!) – to rethink the objective and solve it by taking a logical approach, indeed a practical one.
Have you ever felt that, with the advent of the technology (ML and AI I mean!) we try to force-fit the models everywhere without any proper definition and evaluation of the requirements, needs or investments (ROI, in other words). But still not clear, right?
A fun fact, though I do not hold any statistics on this one, I still feel that – “The rate of an engineer transforming to a data scientist is higher than that of literacy rate itself.” Do you agree?
But, are we really making any practical use of this transformation? It’s an observation, that before we apply any model to the process data, we force ourselves to think like one, right? So we miss out on the logical apprehension or the practical mindset that goes behind it.
Hail Model! That’s right. Machine learning and AI have definitely empowered us to solve many engineering problems in any easy and comprehensive fashion, such as – Real-time predictions of the quality parameters, forecasting the next probable failure event for any asset(s), and many more. It has democratized the Industry in many ways, by detaching the long going dependency on the lab analysis in many operations, dependency on simulations to get the inflicting values of the quality parameters and many more. It has drastically reduced the time for getting the results much earlier, almost in real-time, which earlier took days to get generated from other siloed mechanisms.
But do you really think that these can solve all of your problems? No, right? Moreover, sometimes the infrastructure and technology cost behind such an application is huge, even more than ROI itself. So what should we do? Should we stop thinking about these applications? Or, should we wait till this cost plummets. The answer is a “No”. Then what should we do?
There needs to be a logical approach behind these, which means that someone has given us the power to use the technology, but how to use it, is up to us. In this case, the driver of the technology or the digitalization leaders have taken ownership of such programs. He/She should be well versed with the technology targeting the manufacturing industries. Plethora of solutions are available, so which one to select? This is the next big question, which connects our previous one. So the answer is that the solution should be such easy to use that even the operators or the engineers can learn it. Right? I mean what’s the use of such technology that doesn’t make your life easier. Correct!!
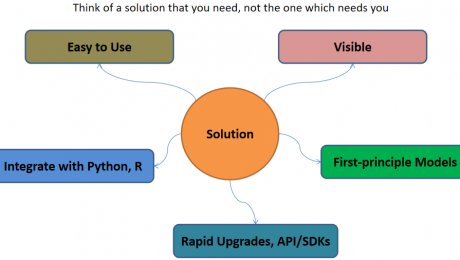
So, coming directly to the solution part, the evaluation criteria or the metrics to keep in mind, before investing, but after envisaging the requirements and need:
- Comprehensible: Simple, easy-to-use solutions – that can get into the hands of operators and engineers (The real industry drivers!!)
- Blend-able: Capability-wise – Easy to mingle with the open-source and widely accepted programming solutions, such as python, R and MATLAB
- Reform-able: Solution should be capable enough of upgrading itself with the uplifting of the technology. Or else, it will get outdated soon. This becomes a really important criteria as one always invests in keeping long-term goals in mind, and not the short ones.
- Visible: The solution should be capable of providing Visuals – be it in terms of trends in real-time or 3D CAD models, like the one in digital twin, which we all dream about.
- Though we say models are a black-box, we still want to see what it is doing, right? At least, what is it outputting? Operators don’t care about which model you apply or what technique you use, then just want to see what is happening inside that piece of equipment with a better view, that’s it.
- Solvable: We all are engineer’s correct? We want to solve equations and correlations, it’s our job. So the solution should be capable enough to allow you to solve some complex algebraic equations – we call it first principle models.

In case you are starting your digitalization journey or being stuck somewhere, we (Process Analytics Group) at Tridiagonal solutions can support you in many ways.
We run the following programs to help the industry along with various needs:
- We run the POV/POC program– For justifying the right analytical approach and evaluating the use cases that can directly benefit your ROI.
- A training session for upskilling the process engineer – How to apply analytics at its best without getting into the maths behind it (How to apply the right analytics to solve the process/operational challenges)
- Python-based solution– Low code, templates for RCA, Soft-sensors, fingerprinting the KPIs, and many others.
- We provide a team that can be a part of your COE– That can continuously help you to improve your process efficiency and monitor your operations on regular basis.
- A core data-science team (Chemical Engg.) that can handle the complex unit processes/operations by providing you the best analytical solution for your processes.
Written by,
ParthPrasoon Sinha
Sr. Data Scientist
Tridiagonal Solutions
- Published in Blog
Connected Analytics for Sustainability in Refinery Operations
With the advent of Technology, Oil and Gas Industry has transformed itself to adapt the best of analytics practices to extract maximum profit, without much expense at the productivity losses. Where, analytics practices include the use of Machine Learning/AI, Hybrid Modeling, Advanced Process Control (APC) and APM to mitigate the existing challenges of production losses, optimization, asset availability and sustainability. For the interest of this article our focus will be more towards achieving Sustainability through advanced analytics approach. Today, Oil and Gas industry is investing heavily to achieve its sustainability goals, through various programs to avoid unplanned downtime, reduce the losses, optimize the raw material, or to even control the COx, NOx, emissions to bring down the global adversary impact of green-house gases on the environment. To support the sustainability programs across industry in a more methodical way, we introduce the concept of ‘Connected Analytics’. Connected analytics, although being a relatively new terminology for manufacturing industry, is a more pronounced terminology in the area of Product Lifecycle Management (PLM), which goes by the name of ‘Digital Thread’. Connected Analytics borrows the core underlying idea in the Oil and Gas production space to support various analytical activities.
How?
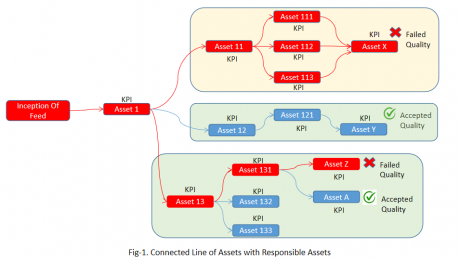
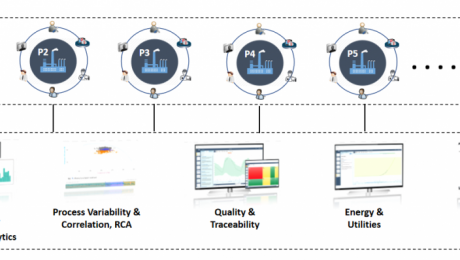
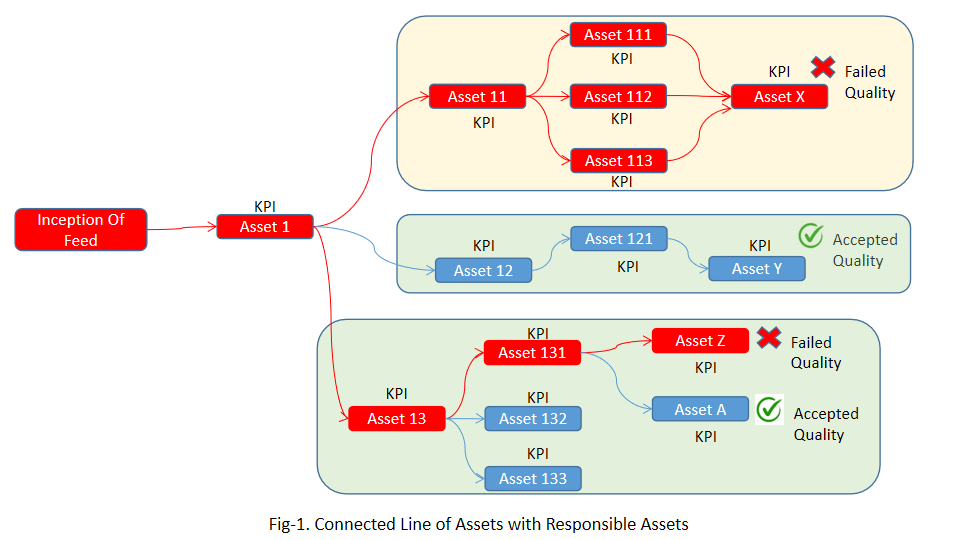
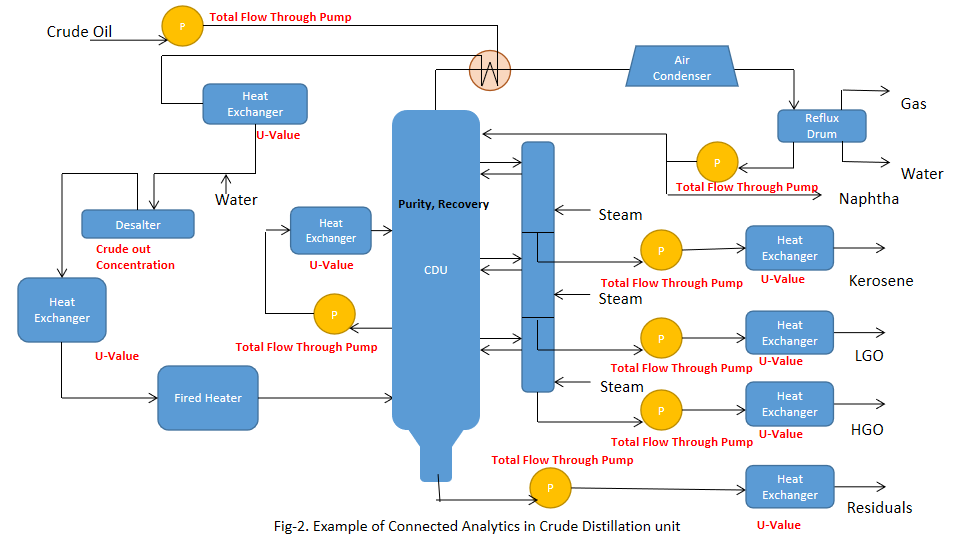
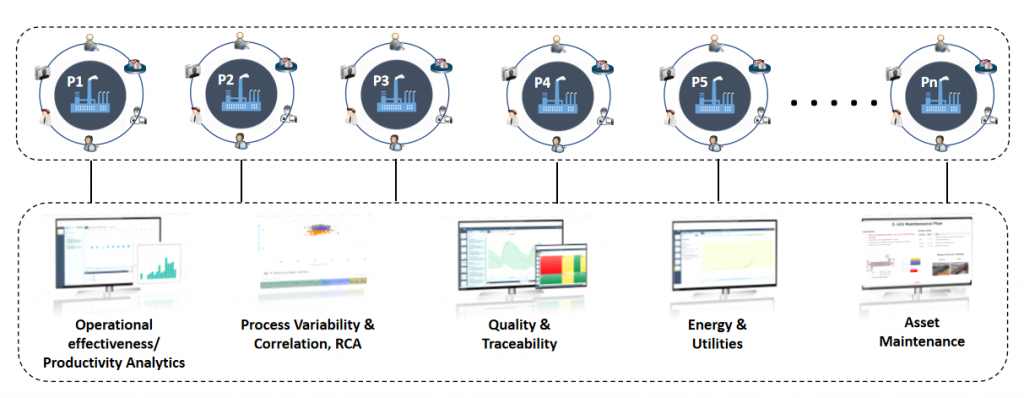
Most of the engineer’s time is spent in troubleshooting the process to maintain their KPIs within the range. This process is time intensive and points to significant losses in production and monetary savings till the operation converges back to its normal condition. Each refinery operation is associated with large number of process variables, which at the time of troubleshooting makes it difficult to control and identify the responsible parameter that caused the anomaly. For such colossal operations with plethora of process parameters, we use ‘Connected Analytics’. Connected Analytics could be understood as the Nexus of Assets/Processes arranged in the order of their place/position in Industry. Today, we spend lots of lime to perform asset level analytics, but what if the quality failure in a specific asset is the outcome of it precursor assets? This has a broader picture to conceive, as we usually do not consider the information of the antecedent processes in terms of failures or anomaly. To mitigate this industrial pain, we introduce P&ID like “Bird’s Eye View” kind of visualization that considers all the interconnected assets, along with an eye on their critical parameters in real time. But to realize profits from such a level of advanced analytics and advanced visualization, industry needs to achieve some predefined level of digital maturity in terms of advanced modeling, softsensors,.etc. Once the prerequisites are set, engineers/operators can have the real-time dashboards for soft-sensors/first-principle driven KPI alongside its assets in the Connected Analytics view to monitor the operations more efficiently.
Written by,
ParthPrasoon Sinha
Sr. Data Scientist
Tridiagonal Solutions
- Published in Blog
Root-cause Analysis for Fault Detection
Challenge:
- Large number of process variables makes it hard to identify the KPIs which are responsible for any deviations or excursions in the process.
- Delay in realization of any excursion from the point in time when it happened.
- Monitoring becomes difficult for the operations which involve large number of variables
- Lack of knowledge about the correlated parameters
Dataset:
- Real-time process data, Batch and continuous operations
Modeling approach:
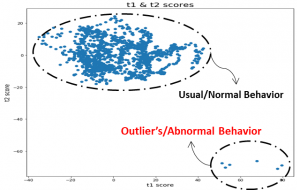
- Principal component Analysis to perform the root cause analysis, and identifying the critical parameters
- Extending the PCA, using t-score plots to realize any anomaly in the operations
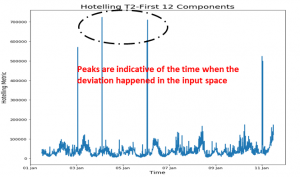
- Time domain analysis to identify any deviations using the concept of Hotelling’s T2 plot
Output:
- Hotelling’s T2 plot enables the operator to take corrective actions against the identified deviations in near-real time
- The dimensionality reduction technique helps the operator to focus on the important process variables that contributes maximum to the variability of the operations
Written by,
ParthPrasoon Sinha
Sr. Data Scientist
Tridiagonal Solutions
- Published in Blog
Sequence model in Oil and Gas Industry-Downstream
What is sequence modeling?
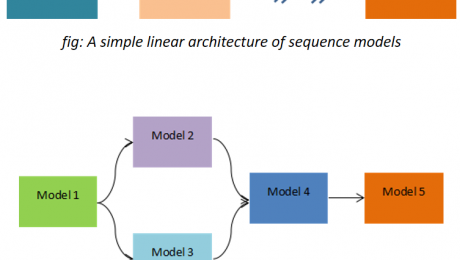
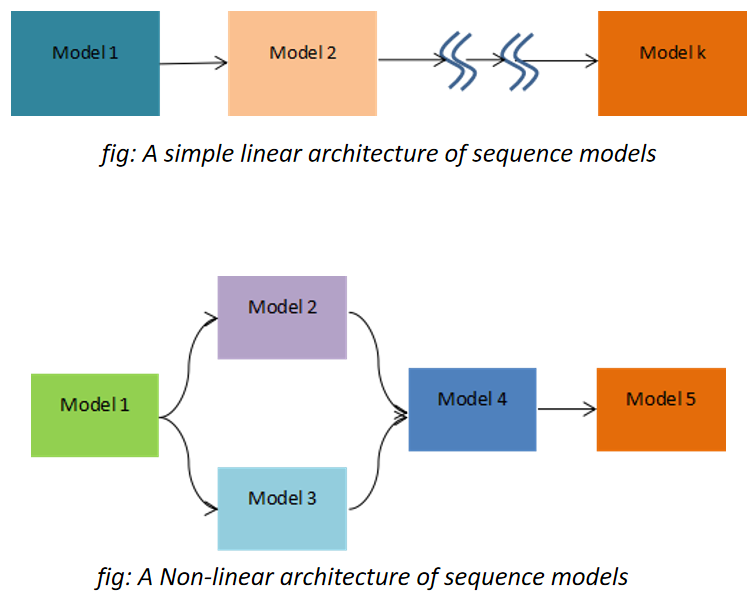
When output from one model is fed as a part of the input in the other model for prediction purpose then we call it as a sequence model. This concept arises when there are more than 2 or more parameters which you want to predict simultaneously. This idea indirectly also indicates something about causality relationship between the inter-parameter relationships. This means that which parameter needs to be predicted first should be pre-determined and similarly for the other parameters. The sequential model outputs should be representative of how the operations or the process happens in the real time. When we speak about causation we mostly think about the manipulative and the controlled variables and not the responding variables in the “Line of action”. But what If there are more than 2 parameters which could be treated as responding variables in the process and you don’t know which one to predict and use it as a final metric. Under such circumstances we can use the sequence model and try to predict one of the responding variables first as a function of the independent parameters and then use this as the input to the other model. The architecture of such model could be very simple as a linear chain or could be as complex as a network of blocks.
And When Sequence Modeling?
This approach could be applied to all such processes where one outcome could be somehow transformed and utilized/consumed as an input in the other model. In does not necessarily mean that in the real practical scenario the outcome from the first is responsible for the outcome from the second model as being a data-driven approach, its volume and variability plays a vital role. A good example to understand this could be through its implementation on the connected processes in the downstream operations, where pump is connected to distillation columns, then re-boiler and condenser in parallel and so on. This process clearly indicates that the output from the pump will surely impact the distillation performance and the other successive process, which makes a complete sense to implement the sequence model here so that the performance of the entire process line could be gauged in a single thread of analytics with multiple knots, identified as a model. So here the first model will be for pump that will predict the output parameter which will be the input for the next operation which is distillation column, and from here two discrete models will run in parallel, one each for re-boiler and condenser. The representation of this entire non-linear modeling plane could get visualized in a single dashboard, where each box could represent a unit –operation/process.
Many a times it’s possible that your responding variables are not directly associated with each other, but the nature of data over time brings a reason for you to utilize this concept. Yes it happens!! The behavior/trend of the data could also be used to identify and arrange the output parameters in the models sequentially. One such use case could be when your controller is really a bad performer (Meaning that you are mostly off-spec and at sub-optimal operations). Always you see a huge difference in the set and the real indicated values. In such cases you can try to create a ML/AI model (First model) that uses the independent process parameters to predict the real values, and then this predicted real value can be used in a second model that predicts the set value as the output. Essentially it prescribes the engineer by telling him what value to set next, by mapping the process and the controller non-linear behavior.
Written by,
ParthPrasoon Sinha
Sr. Data Scientist
Tridiagonal Solutions
- Published in Blog
When, why & how should you Monitor the Assets?
With this article we will try to establish our understanding around when, why and how monitoring the assets can solve the business problem. Monitoring the assets or prognostics analytics seems to be very widely used technique, which has been accepted across many Oil and Gas industry. When we say “Monitoring”, a direct implication could be – Monitoring the process parameters or the important KPIs for the Assets.
But wait a second, if we do not have the KPI readily available from a sensor then? How can we derive a metric that can aptly be utilized for making our analytics possible in real-time. Are there any techniques available?
One big challenge that pops-up when we are trying to solve the process related asset is that no single parameter dictate the behavior of the entire process, instead it’s the combination of multiple parameters. This arises due to the fact that there are multiple unit processes going on in the equipment, which attributes to large variability in the system. So a key insight from such process is that, there lies a significant possibility of having a multiple operating conditions(combination of them) where your process may diverge or converge.
So how can we address such challenges?

Lets take a step by step approach to understand this.
When Monitoring
Monitoring becomes a prominent approach when we are looking into the real-time variability analysis, but what signal to monitor, comes either from SMEs or through applying advanced ML/AI models. Advanced ML (supervised or unsupervised) helps us to identify the important KPIs depending upon the behavior of the data. The signals that these model predict are also known as ‘Soft-Sensors’, which is derived using the unified approach of data-driven techniques and science. One observation with the Assets, which are “industry enabler’s” is that they have established itself to the point where we know the KPIs with a strong conviction. Which means that, monitoring these specific parameters will be sufficient enough to estimate its performance. But there are assets for which the performance is heavily governed using the process reactions, mass transfer, heat transfer..etc, which makes it difficult to identify the KPIs that would dictate the process. In such cases monitoring wouldn’t help if you are bereft of the critical parameters.
This makes sense right? As monitoring will only help if you know what to monitor!!
So, for process oriented assets we still have more to explore to establish the right metric for identifying the KPIs. By making use of the soft-sensors modeling techniques one can create the KPIs that we can monitor in the real-time. For more information on how to make the best use of soft-sensor please have a look into my earlier blog on soft -sensors.(See below)
Why Monitoring
Monitoring always helps you to maintain your process deviations and abnormalities in control, if you know what to monitor. In recent advances it has seen a huge potential – Increasing your ROI just by monitoring your assets. But as discussed monitoring is more reliable where the undergoing process is fairly simple and we know what signal to monitor to improve your process performance. This kind of analytics is heavily used for assets such as pumps, compressors, heat exchangers, fans, blowers..etc. And since predicting the failure of such assets beforehand can surmount the production losses and inefficiencies in the downstream processes.
Similar kind of philosophy goes behind the processes with the only challenge being that you should know how to derive those KPIs (Which is to be monitored). Today, industry rely heavily on lab analysis for quality check in the product stream, or depends totally on equipment such as gas chromatography..etc to check the efficiency of the separation (Just an example). But due to the advancements in the technology and computational capacity, we can work on those historical data from lab (quality data) and create a workaround for modeling the soft-sensors (Derived KPIs-Refer my previous article on soft-sensors). These soft-sensors enable the engineers to detach their dependencies from the lab analysis and monitoring equipment.
In short, the mathematical model looks for its suitable and applicable place to help the operator by letting him get rid of the old techniques. Moreover, this way your dependencies on the first principle models also gets reduced to some extent, otherwise this was the only source of reliability earlier. More justice to such new techniques could be done if the data collected is sufficient enough, with not much expense on the data integrity. (See below)
How Monitoring
How monitoring can solve your business challenges? Good question, isn’t?
So let’s understand first how the outcome of a data analytics use case is consumed in the industry. The operator/engineer looks for a solution which is comprehensive to him and speaks the process language, which is compilation of the entire analytics in a single screen. This is also known as a dashboard, a dynamic dashboard more precisely. There are tools and platforms available that can easily load your indicators and update it in real-time. This solution also keeps the actual environment of the analytics/code separated from the operators so that they can focus more on the consumption part, rather than focusing on how this analytics was created. (One such known solution is Seeq, which can take care of performing the analytics and then publishing the content in a dynamic dashboard for operators)
Explained with a use case: Distillation column
In this case our objective was to predict the column vapor pressure and the important KPIs, which is mostly done through lab analysis today. Before we move ahead, let us see the list of tags that were collected:
1. Temperatures for Distillation Column and Re-boiler (Real time Process Condition)
2. Pressure (Real time Process Condition)
3. Flow rates (Real time Process Condition)
4. Vapor Pressure (Lab analysis)
3 years worth of data was collected with a sampling rate of 5 mins.
Note: Data sanity check was performed before applying the model for creating the soft-sensor.
For the interest of this article our focus will only be the soft-sensor which we will be monitoring in the real time to observe the performance. Please note that the KPIs which were identified should also be monitored to keep the deviations in the operations under limit to improve the controller actions. But since the direct parameter to monitor the quality is the soft sensor, so we will keep it in the lime light.
Steps:
1. The vapor pressure data was regressed against the process parameters using random Forest model
2. GridsearchCV was used to tune the hyper-parameters for achieving the maximum accuracy
3. The model was trained on 2.5 years of dataset and the rest was used for testing purpose
4. The reliability of the trained model was check for its consistency on the multiple shuffled dataset. The
standard deviations in the model metric was checked to evaluate the robustness of the model and it’s predictive
power
5. And finally the predicted signal or the soft-sensor was used on the production data for real time predictions

I really hope that this article helped you to benchmark your strategy for deriving the right analytical strategy in your Industrial Digitization journey. For this article our focus was on monitoring the right KPIs – soft-sensors for your process driven Assets, and stay tuned for more interesting topics.
Who We Are?
We, Process Analytics Group(PAG), a part of Tridiagonal Solutions have the capability to understand your process and create a python based template that can integrate with multiple Analytical platform. These templates can be used as a ready-made and a low code solution with the intelligence of the process-integrity model (Thermodynamic/first principle model) that can be extended to any analytical solution with available python integration, or we can provide you an offline solution with our in-house developed tool (SoftAnalytics) for soft-sensor modeling and root cause analysis using advanced ML/AI techniques. We provide the following solutions:
- We run a POV/POC program – For justifying the right analytical approach and evaluating the use cases that can directly benefit your ROI.
- A training session for upskilling the process engineer – How to apply analytics at it’s best without getting into the maths behind it (How to apply the right analytics to solve the process/operational challenges)
- Python based solution- Low code, templates for RCA, Soft-sensors, fingerprinting the KPIs, and many others.
- We provide a team that can be a part of your COE, that can continuously help you to improve your process efficiency and monitor your operations on regular basis.
- A core data-science team (Chemical Engg.) that can handle the complex unit processes/operations by providing you the best analytical solution for your processes.
Written by,
ParthPrasoon Sinha
Sr. Data Scientist
Tridiagonal Solutions
- Published in Blog
Soft Sensor – Intelligence to Operationalize your Industry – Oil & Gas
What is Soft-sensor?
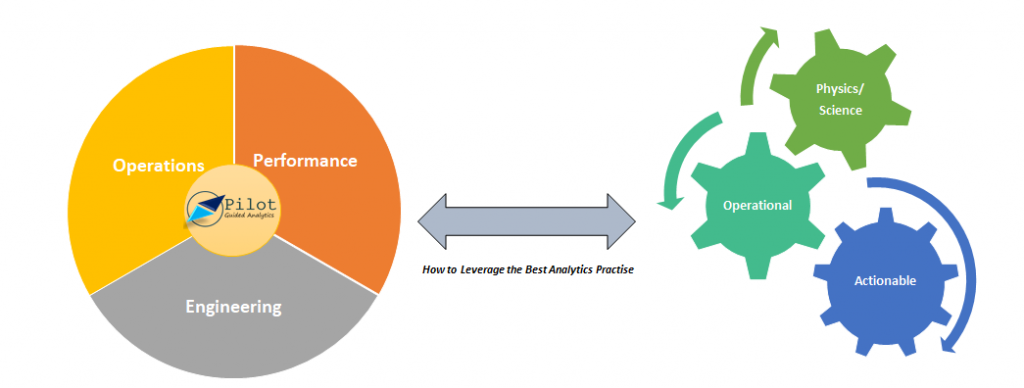
Soft-sensor is a fancy term for the parameters which are derived as a function of the sensor- captured parameters. These could also be termed as “Latent Variables”, which are not readily available, but is required as a key metric to estimate the process/asset performance.
Why Soft-sensor?
As said above, soft-sensors are the the key metric that dictate the efficiency and performance of any process or the asset. The evaluation of these parameters become a necessity when monitoring the real-time performance of the system and enabling the future predictions for failure preventions and performance assessment.
How to derive a Soft-sensor?
This question becomes important in-order to devise a right metric to derive the soft-sensor. These parameters could either be estimated through data-driven techniques or through first principle models. Typically, we leap through the following steps to generate a soft-sensor:
- Select/Evaluate the right soft-sensor which is required to estimate the performance
- Gather all the required constants or the sensor signals which will be required to develop it.
- Look for the possible ways (Data-driven/Mechanistic) to evaluate it
- Test it in the production environment, and estimate it’s direct inference in the real-time operations
- If satisfactory, then use various forecasting rules/techniques to estimate the performance in the successive events
Soft-Sensor in Oil and Gas Industry
Soft-sensors has recently observed a lot of attraction in Oil and Gas industry. It’s been used heavily for assessing the performance of the industry enablers/assets such as Heat Exchangers, pumps, compressors…etc. Deriving such parameters becomes hard when we try to implement it in a process which is heavily governed by the first-principle/mechanistic models. This also brings in the requirement of integrating those models into the analytics workspace for a convenient and reliable analysis.
Let us look into the two different scenarios(Use cases) where we will be using soft-sensors derived through 1) Advanced Machine Learning Techniques, and 2)Mechanistic Techniques:
Use case I:
Debutanizer column performance prediction:
For debutanizer column performance is dictated by the extent of separation that happens to obtain a high purity C4 fraction from the tops as LPG (gasoline is obtained as the bottoms).

This image is taken from https://modeldevelopment.thinkific.com
The challenge with this process comes when the gas chromatograph which is used for real time monitoring of the C4 fraction in the stream is off-due to maintenance. Such situation handicaps the operator/engineers to qualify the process performance. The lab analysis for estimating the quality of the product takes a while(few hours) to verify the process performance that happened in the past. This shows that gas chromatograph becomes a necessity to evaluate the process performance in real time, but due to its own maintenance challenges it brings in a major requirement to replace it with the possible mathematical model that can operate for all time without any operational failure in it’s own. This mathematical model can also be a potential replacement for lab analysis if developed with all the required parameters and assumptions.
For this process the sensor available data includes flow-analyzer, temperature, pressure from various controllers in the set input stream.
A machine learning model could be utilized to establish a model between C4 fractions from the lab and the sensor parameters by capturing the inherent linear/non-linear behavior. The predicted model in comparison to the actual C4 value could be seen in the figure below:

This approach becomes very important because Oil and Gas industry is heavily dependent upon the separation technologies, primarily the distillation column. If utilized properly, then most of the operations can be automated in-order to bring about efficiency in the process, and also in terms of the incurred production losses.
Technologies such as ASPEN can also be utilized to generate the synthetic data, which can be used to develop the model. Then it also opens-up the gateway for modeling the soft-sensor for variability estimation in the input stream such as composition changes, temperature deviations, and many others. A whole network of the process can be viewed and analyzed using our “Analytics Thread” approach, that can identify the precursor failures/abnormalities with respect to the subjected process.
Use case II:
Compressor Modeling and performance prediction:
Monitoring equipment such as compressor, heat exchanger and pumps becomes important as they are many in numbers and failure of one such asset can stop the successive production events, which can cause huge monetary losses. The only task of such equipment is either to enable the industry with required and necessary flow, or to maintain the stream with the required Temperature and Pressure.
Due to continuous flow of the oil/water streams(impurities) through these assets, corrosion/scaling/fouling becomes a major process challenge that can bring down it’s life cycle and reduce the performance eventually.
The challenge with compressor performance monitoring is that the only available sensor data is its suction and discharge pressure and temperature, which is not sufficient enough to estimate its efficiency. We need to bring the thermodynamic part of the intelligence to the analytics layer. Right, the thermodynamics model which in this would be isentropic path exponent, polytropic path exponent and efficiency, power equations, ideal gas law, compressor chart for discharge pressure and power…etc.
Although these parameters are not available in real-time basis, but these mechanistic model/equations can be integrated in the analytics layer to enable it’s calculation in the near real-time.

This use case was developed in seeq platform
Once these equations are ready, we can layer the prediction model on the training dataset to create a model that is purely the function of the sensor recorded data, by capturing the highly complex/non-linear behavior of the system. This way one can reduce the computational cost that went behind these set of calculation for every new data received.
Innovate your Analytics
I really hope that this article helped you to benchmark your strategy for deriving the right analytical strategy in your Industrial Digitization journey. For this article our focus was on soft-sensors, stay tuned for more interesting topics.
Who We Are?
We, Process Analytics Group(PAG), a part of Tridiagonal Solutions have the capability to understand your process and create a python based template that can integrate with multiple Analytical platform. These templates can be used as a ready-made and a low code solution with the intelligence of the process-integrity model (Thermodynamic/first principle model) that can be extended to any analytical solution with available python integration, or we can provide you an offline solution with our in-house developed tool (SoftAnalytics) for soft-sensor modeling and root cause analysis using advanced ML/AI techniques. We provide the following solutions:
- We run a POV/POC program – For justifying the right analytical approach and evaluating the use cases that can directly benefit your ROI.
- A training session for upskilling the process engineer – How to apply analytics at it’s best without getting into the maths behind it (How to apply the right analytics to solve the process/operational challenges)
- Python based solution- Low code, templates for RCA, Soft-sensors, fingerprinting the KPIs, and many others.
- We provide a team that can be a part of your COE, that can continuously help you to improve your process efficiency and monitor your operations on regular basis.
- A core data-science team (Chemical Engg.) that can handle the complex unit processes/operations by providing you the best analytical solution for your processes.
Written by,
ParthPrasoon Sinha
Sr. Data Scientist
Tridiagonal Solutions
- Published in Blog
Debutanizer Column (Distillation Column) Monitoring
- Published in Oil & Gas
Cooling Tower – Analysis of Temperature & Total Power Prediction
- Published in Oil & Gas
