Solar Power Plant Inverter Anomaly Detection
- Published in Renewable Energy
Identification, Categorization, and Reporting of Performance Losses
- Published in Oil & Gas
How You Can Solve Problems with Root Cause Analysis

Root cause analysis, or RCA, is an incredibly helpful process in identifying and solving problems in business. Particularly in industries like oil and gas and others in the sector, small problems can cause big issues, often without really becoming apparent. RCA is essentially designed to make it easier to spot these inefficiencies and imperfections, and thus take steps to address them.
With that said, RCA isn’t necessarily an exact or perfectly defined process you can simply put into action. It is more of a method that needs to be applied strategically. To that end, here are a few important ways to work toward solutions through root cause analysis.
Avoid Broad Assumptions
The quickest way to render RCA moot is to color your efforts with broad assumptions about what might be going wrong with the business. To give a simple example with regard to the energy sector, consider an oil and gas company that sees two months of profits lower than in the corresponding months from the year before. It’s a rather blatant example, but it’s, in theory, the sort of thing that might trigger some root cause analysis.
However, Coloring that analysis with assumption might mean assuming that the downward trajectory in business is part of a long-awaited clean-energy takeover. Many in oil and gas are apprehensive about alternative energy takeovers, and if lower profits correspond at all with positive news in renewables, the assumption comes naturally. One reason for the decline in business from one year to the next would seem likely to be a result of a broad market shift.
Not only is this too simplistic to result in much helpful insight, however — it’s also not necessarily likely to be true. Renewable energy is catching up, but is not yet in takeover territory. Indeed, an interview with a University of Cologne expert on the matter just last year was still discussing a more sustainable future in somewhat aspirational terms, suggesting that such a future will come about “when we finally realize we are all connected.” This doesn’t mean that alternative energy couldn’t be responsible for a decline in oil and gas profits. However, it does speak to how a broad assumption of this nature can be misguided, and can thus derail RCA before it really gets started.
Start Working Backwards
In a sense, the phrase “work backwards” just about describes the entire nature of a root cause analysis. This is a process through which you are meant to first identify a problem and then dig into what led to that problem until you find the very “root cause” behind it. However, there is a more specific way to go about this effort, which will ensure the greatest likelihood that you’ll follow the thread to its origin, so to speak.
An outline of proper RCA by Towards Data Science does an excellent job of illustrating the process in step-by-step terms, for those who are less familiar with it. Broadly, the steps are broken down into three parts: identifying contributing factors (to the problem); sorting those factors; and then classifying the factors. The sorting process involves ranking different factors by the likelihood that they caused the problem, whereas classification essentially means re-sorting into groups representing correlation, contribution, or “root cause” status.
Following these steps, you can also set about “designing for RCA,” which essentially means structuring business operations in a way that produces data and makes it easier to conduct future analyses. This incidentally, brings us to our next point regarding how you can bring about effective problem solving via root cause analysis.
Use Expert Data Analysis
Data analysis is so rampant in the industry today that it can seem like something you have to simply figure out how to implement yourself, or else purchase special software for. These are both options, but it’s also true that the spread of analytics has led to more of a workforce in the category too. Because of the clear value of data, many have gone back to school or pursued online degrees in order to qualify for excellent new jobs, and the result is a virtually bottomless pool of experts. Per the online master’s in data analytics program at Maryville University, numerous research and analyst positions in data are poised to grow by 10% or more over the course of this decade.
Oil, gas, and energy are not specifically mentioned, but as you likely know if these are the fields you work in, data analytics have very much entered the picture. This makes it reasonable to at least consider making use of educated data experts to “design for RCA,” and even conduct RCA when problems arise. While root cause analysis is designed in such a way that anyone with access to relevant information can go about it to some extent, a data professional will be more efficient at knowing what data needs to be visible, and how to make use of it in problem-solving.
Avoid Shallow Analysis
This final piece of advice is simply a reminder, but one to hold onto no matter how thoroughly you set up your RCA to be. In plain terms, make sure you aren’t doing shallow analysis, and stopping at identifying some causes but not a root cause.
By and large though, the path to effective problem-solving with root cause analysis is simple: Be thorough, use as much relevant data as you can, and don’t stop digging further into causes until you can’t go any further. To illustrate, check out how we used ‘Root-cause Analysis for Fault Detection’ in a previous post.
Written by,
Bernice Jellie
- Published in Blog
Predicting CO and NOx emissions from Gas Turbines
- Published in Oil & Gas
How Seeq enables the Practice of MLOps for Continuous Integration and Development of the Machine Learning Models
Introduction:
Due to the rapid advancement in technology, the Manufacturing Industry has accepted a wide range of digital solutions that can directly benefit the organization in various ways. One of which is the application of Machine Learning and AI for predictive analytics. The same industry which earlier used to rely on MVA and other statistical techniques for inferencing the parametric relationship has now headed towards the application of predictive models. Using ML/AI now they have enabled themselves to not only understand the importance of parameters but also to make predictions in real-time and forecast the future values. This helps the industry to manage and continuously improve the process by mitigating operational challenges such as reducing downtime, increasing productivity, improving yields and much more. But, in order to achieve such continuous support for the operations in real-time, the underlying models and techniques also need to be continuously monitored and managed. This brings in the requirement of MLOps, a borrowed terminology from DEVOps that can be used to manage your model in a receptive fashion using its CI/CD capabilities. Essentially MLOps enables you to not only develop your model but also gives you the flexibility to deploy and manage them in the production environment.
Let’s try to add more relevance to it and understand how Seeq can help you to achieve that.
Note: Seeq is a self-service analytics tool that does more than modeling. This article is assuming that the reader is familiar with the basics of the Seeq platform.
Need for Seeq?
Whenever it comes to process data analytics/modeling, visuals become very much important. After all, you believe in what you see, right?
To deliver quick actionable insights, the data needs to get visualized in the processed form which can directly benefit the operations team. The processed form could be the cleaned data, derived data, or even the predicted data, but for making it actionable it needs to be visualized. The solutions should peacefully support and integrate with the culture of Industry. If we expect the operator to make a better decision then we also expect the solution to be easily accepted by them.
MLOps in Seeq
For process data analytics models could accept various forms such as first principle, statistical or ML/AI models. For the first two categories, the management and deployment become simple as it is essentially the correlations in the form of equations. Also, it comes with complete transparency, unlike ML/AI models. ML/AI on the other hand is a black-box model, adds a degree of ambiguity and spontaneity to the outcomes, which requires time management and tuning of the model parameters. This could be either due to the data drift or the addition/removal of parameters from the model inputs. To enable this workflow Seeq provides the following solution:
- Model Development:
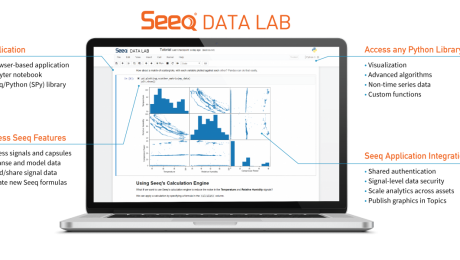
One can make use of Seeq’s DataLab (SDL) module to build and develop the models. SDL is a jupyter-notebook like interface for scripting in python. Using SDL you get the facility to access the live data to select the best model and finally create a WebApp using its AppMode feature for a low-code environment. As a part of best practice, one can use spy.push method to extract the maximum information out of the model using Seeq Workbench and advanced Visualization capabilities.
- Model Management (CI/CD):
Once the model is deployment-ready, the python script for the developed model can be placed in a defined location in the server for accessing the production environment. After successful authentication and validation, the model can be seen to have visibility in its list of connectors. This model can then be linked with the live input streams for predicting the values in real-time.
- Visibility of the Model:
Once the model is deployed in the production environment, one can continuously monitor the predictions and get notified of any deviations which may be an outcome of data drift. The advanced visualization capabilities of Seeq enables the end-user to extract maximum value/information out of the data with the ease and flexibility of its use.
For a better deployment and utility of MLOps, we recommend you apply visual analytics for your data and model workflow. Visual analytics at each stage of the ML lifecycle provides a capability to derive better actionable insights which could be easily scaled and adopted across the organization for orchestrating the siloed information and to unify them for an enhanced outcome.
Innovate your Analytics
I really hope that this article helped you to benchmark your strategy for deriving the right analytical strategy in your Industrial Digitization journey. For this article, our focus was on how Seeq can support the easy implementation of MLOps using Industrial manufacturing data.
Who We Are?
We, Process Analytics Group (PAG), a part of Tridiagonal Solutions have the capability to understand your process and create a python based template that can integrate with multiple Analytical platforms. These templates can be used as a ready-made and a low code solution with the intelligence of the process-integrity model (Thermodynamic/first principle model) that can be extended to any analytical solution with available python integration, or we can provide you an offline solution with our in-house developed tool (SoftAnalytics) for soft-sensor modeling and root cause analysis using advanced ML/AI techniques. We provide the following solutions:
- We run a POV/POC program – For justifying the right analytical approach and evaluating the use cases that can directly benefit your ROI.
- A training session for upskilling the process engineer – How to apply analytics at its best without getting into the maths behind it (How to apply the right analytics to solve the process/operational challenges)
- Python-based solution- Low code, templates for RCA, Soft-sensors, fingerprinting the KPIs, and many others.
- We provide a team that can be a part of your COE that can continuously help you to improve your process efficiency and monitor your operations on regular basis.
- A core data-science team (Chemical Engg.) that can handle the complex unit processes/operations by providing you the best analytical solution for your processes.
Written by,
ParthPrasoon Sinha
Sr. Data Scientist
Tridiagonal Solutions
- Published in Blog
Statistical and Machine Learning for Predictions and Inferences – Process Data Analytics
Introduction:
When it comes to the process industry, there are a plethora of operational challenges, but not a single standard technique that can address all of these. Some of the common operational challenges include identification of critical process parameters, control of process variables and quality parameters, and many more. Every technique has its own advantages and disadvantages, but to make its use at – its best, one should be aware of “What to use“, “And When”? This is really an important point to consider as there are so many different types of models that can be used for a “fit-for-requirement” purpose. So, let us try to have a deeper view of the modeling landscape.
Statistical models in the Process Industry
Statistical models are normally preferred when we are more interested in identifying the relationships among the process variables and output parameters. These kinds of models involve hypothesis testing for distribution analysis, which helps us to estimate the metrics, such as mean and SD of the sample and population. Whether or not, your sample is a generalized representation of your population? This is an important piece of concept which goes as the initial information for any model building exercise. Z-test, chi-squared, t-test (Univariate and multivariate), ANOVA, least squared and many other advanced techniques can be used to perform the statistical analysis, and estimate the difference in the sample and population dataset.
Let us try to understand this with an example: Considering the process of distillation, let’s say that you have the dataset available for its Feed Pressure, Flowrate, Temperature and Purity of the top stream. Now from its availability perspective, assume that you have 1 year’s worth of the data. Then, you segregated your dataset in some ratio, let’s go by 7:3 for training and testing purposes, and applied some model. But the model didn’t seem to comply with your expectations, in terms of the desired accuracy. So, what could have gone wrong? There are many possibilities, right? For the interest of this article let us just focus on the statistical inferences. So, since your model was not able to generalize its understanding on the distillation dataset, we may want to set an inquest for the dataset first. How? Did we compare the mean and SD of the train and test dataset? No? Then we should!! As discussed above, that to set up a model for reliable predictions, we need to be sure that the sample (In this case-training and testing dataset) is representative of your population dataset. This means that mean and SD values should not see much significant change in the above 2 datasets and also when compared to any random samples drawn from the historical population dataset. This also gives to us an idea about the minimum volume of the dataset which should be required to estimate the model’s robustness and predictability. Also to support the predictability confidence of any parameter on the output variable, we can use p-value. It essentially shows the statistical significance/feature importance of the input parameters.

Machine Learning Models in the Process Industry
So, now we have some idea on the importance of statistical models using process data. We can know the parametric relationship among each other and quality parameters. And then using the Machine learning models we can enable the predictions.
Typically, what we have seen in any process industry is, they need correlations and relationships in the form of an equation. A black-box model sometimes adds more complexity in the practical applications, as it does not provide any information on how and what was done to establish the prediction.

Sometimes even a model with 80% accuracy is sufficient if it provides enough information on the relationship is established among the process parameters. This being the reason, first, we always try to fit a parametric model, such as a linear or a polynomial model with the desired scale on the dataset. This atleast gives us a fair understanding of the amount of variability and interpretability contained in each of the paired parameters.
Conclusion
We can say that predictions and inferences/interpretability should always go hand-in-hand in the process industry for a visible and reliable model. The prediction itself is not sufficient for the industry, they need more, like – if the predicted value is not optimal or if it does not meet standard specifications, then what should be done? A recommendation or a prescription in the form of an SOP that the operator or an engineer can follow to bring the process back to its optimal state, which comes from the statistical inferencing. We suggest that for a strategic digitalization deployment across your organization, you use the best of both techniques.
To know more on how to use these techniques for your specific process application, kindly contact us.
Who We Are?
In case you are starting your digitalization journey or being stuck somewhere, we (Process Analytics Group) at Tridiagonal solutions can support you in many ways.
We run the following programs to help the industry along with various needs:
- We run the POV/POC program– For justifying the right analytical approach and evaluating the use cases that can directly benefit your ROI.
- A training session for upskilling the process engineer – How to apply analytics at its best without getting into the maths behind it (How to apply the right analytics to solve the process/operational challenges)
- Python-based solution– Low code, templates for RCA, Soft-sensors, fingerprinting the KPIs, and many others.
- We provide a team that can be a part of your COE– That can continuously help you to improve your process efficiency and monitor your operations on regular basis.
- A core data-science team (Chemical Engg.) that can handle the complex unit processes/operations by providing you the best analytical solution for your processes.
Written by,
ParthPrasoon Sinha
Sr. Data Scientist
Tridiagonal Solutions
- Published in Blog
Compressor Performance Monitoring & Efficiency Prediction
- Published in Oil & Gas
